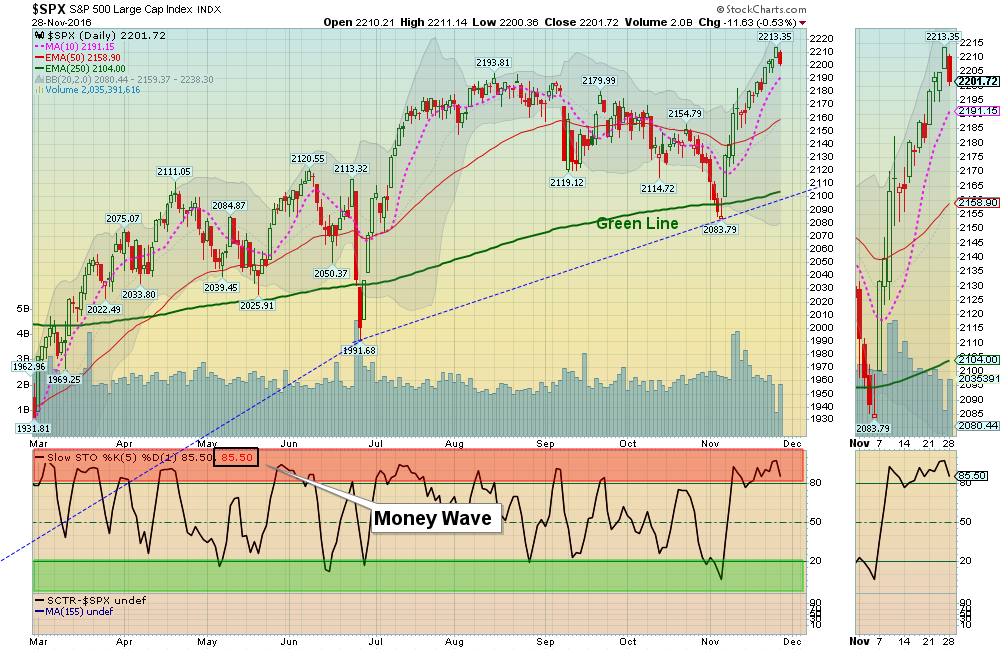
S&P should bounce near the Pink Line (10-day avg.)
11/28/2016: Markets pulled back today from being extremely over-bought. The S&P 500 should be able to bounce soon around the Pink Line, and go back up to re-test recent Highs. Next good Buy point should be around the Red Line (50-day avg.) The Leading Funds are back up in the Red Zones (probably too late to Buy for the short term), so RAISE CASH.
Now is the time to have patience & WAIT for Money Waves to return to their Green Zones.
Wait for Money Waves Buys soon. We will email you when they are ready. Watch List
Click for Charts for Leaders
Click for Current Open Positions
Click for Closed Positions
Alert! Market Risk HIGH (Red Zone). The probability of successful Short Term Trades is lower, when the S&P 500 is Way Above the Green Line. Even the Strongest Funds can get chopped up. Either take quick gains from Money Wave Pops, or STAY IN CASH & WAIT for a larger correction.