• Market Insights
        • Commentary
          • Daily
          • Weekly
        • BUY / SELL SIGNALS
          • Trade Posts
          • Recent Trade Alerts
          • Recent Day Trades
        • BLOGROLL
          • Dividend Growth Blog
          • ETF Sector Blog
          • Dow Dogs
          • TPOW Blog
  • Strategies
        • SWING TRADING
          • Current Positions
          • Watchlists
          • Closed Positions
          • Candidates - TOP 100
          • Specialty Stocks
        • WEEKLY STOCK PICK
          • TPOW Charts
          • TPOW Performance
          • TPOW Strategy Guide
          • TPOW Performance Dashboard
        • DAY TRADING
          • Watch List
        • ATGL DASHBOARD
        • ETF STRATEGIES
          • ETF Sector Rotation
          • ETF Sector Portfolio
        • DIVIDEND GROWTH
          • Dividend Growth Portfolio
          • Dividend Calendar
        • DOGS OF THE DOW
          • Dogs of the Dow Portfolio
          • DOW 5 Portfolio
  • Markets
        • US MARKET
          • Commodities
          • Energy
          • Precious Metals
          • Volatility
        • GLOBAL MARKETS
          • Market Indices
          • Economic Calendar
          • FOREX Heat Map
          • FOREX Cross Rates
          • Crypto Currency Market
  • Investing
    • Discord Community
    • Dashboard
  • Resources
        • ARTICLES
          • Dividend Growth Model Articles
          • ETF Articles
          • Investment Strategies Articles
          • Market and Economic Insights
          • Stock Trade Articles
          • Stock Reviews
        • TOOLS
          • Stock Scanners
          • Charting Software
          • Brokerage Firms
        • STOCK CHARTS
          • Key Components
          • Reading Charts
          • Drawing Stock Charts
          • Identifying Trends
        • RETIREMENT PLANNING
  • About
    • Contact Us
    • How to Win
    • #1 At Stockcharts
    • Disclaimer
    • FAQ
  • Log In
  • Subscribe
Menu
  • Market Insights
    • Commentary
      • Daily
      • Weekly
    • BUY / SELL SIGNALS
      • Trade Posts
      • Recent Trade Alerts
      • Recent Day Trades
    • BLOGROLL
      • Dividend Growth Blog
      • ETF Sector Blog
      • Dow Dogs
      • TPOW Blog
  • Strategies
    • SWING TRADING
      • Current Positions
      • Watchlists
      • Closed Positions
      • Candidates – TOP 100
      • Specialty Stocks
    • DAY TRADING
      • Watch List
    • WEEKLY STOCK PICK
      • TPOW Charts
      • TPOW Performance
      • TPOW Strategy Guide
      • TPOW Performance Dashboard
    • DIVIDEND GROWTH
      • Dividend Growth Portfolio
      • Dividend Calendar
    • DOGS OF THE DOW
      • Dogs of the Dow Portfolio
      • DOW 5 Portfolio
    • ETF STRATEGIES
      • ETF Sector Rotation
      • ETF Sector Portfolio
    • ATGL DASHBOARD
  • Markets
    • US MARKET
      • Commodities
      • Energy
      • Precious Metals
      • Volatility
    • GLOBAL MARKETS
      • Market Indices
      • Economic Calendar
      • FOREX Heat Map
      • FOREX Cross Rates
      • Crypto Currency Market
  • Investing
    • Discord Community
    • Dashboard
  • Resources
    • ARTICLES
      • Dividend Growth Model Articles
      • ETF Articles
      • Investment Strategies Articles
      • Market and Economic Insights
      • Stock Trade Articles
      • Stock Reviews
    • TOOLS
      • Stock Scanners
      • Charting Software
      • Brokerage Firms
    • STOCK CHARTS
      • Key Components
      • Reading Charts
      • Drawing Stock Charts
      • Identifying Trends
    • RETIREMENT PLANNING
  • About
    • Contact Us
    • How to Win
    • #1 At Stockcharts
    • Disclaimer
    • FAQ
  • Log Out
    • Members-Page
    • Referral
  • Log In
  • Subscribe
Log In
Log Out
Subscribe

Market-2

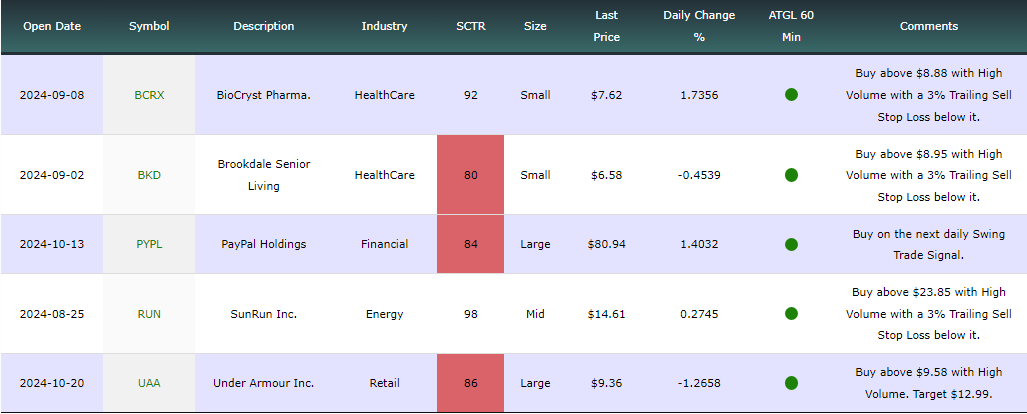
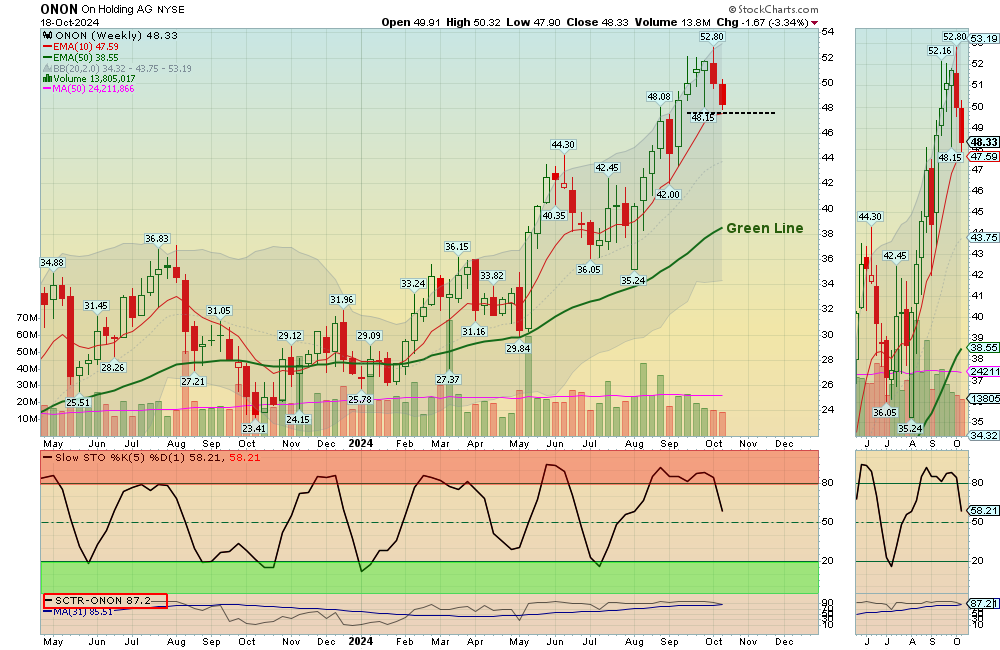
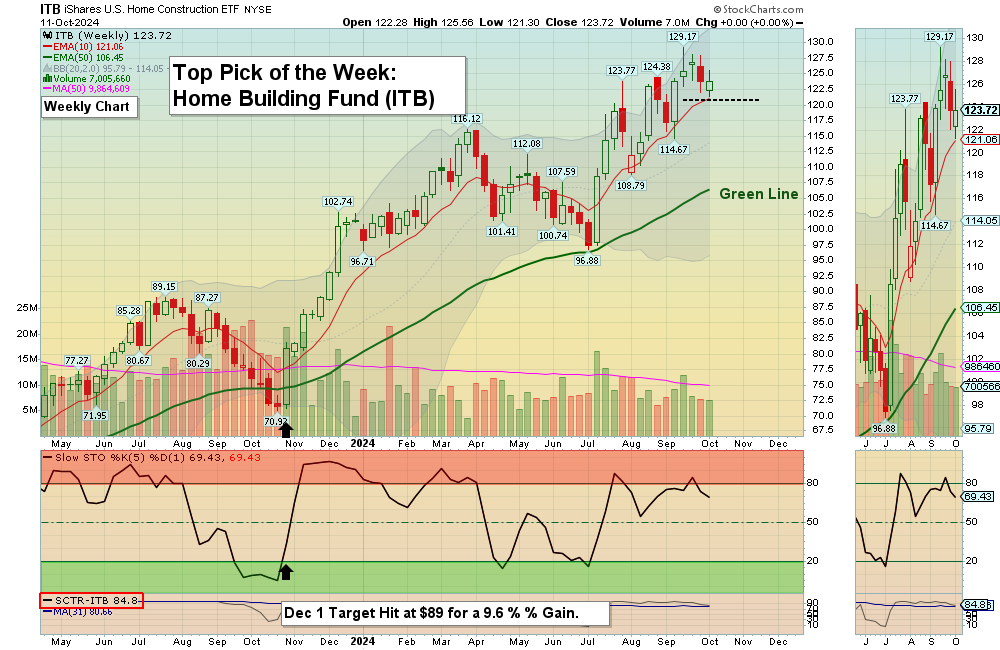
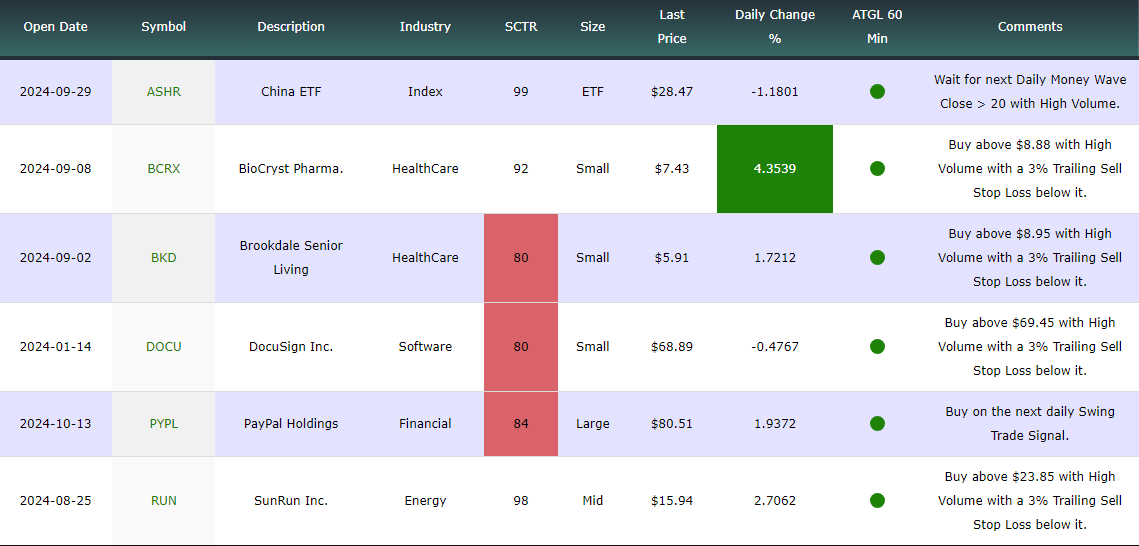
Above the Green Line © is a Newsletter System of rotating into Investments that generally have more Buyers than Sellers (Above the Green Line, which is Above the 250 day exponential moving average), and the highest Relative Strength (> 90 Relative Strength).

This System is designed to Buy High, and Sell Higher, where we BUY on the DIPS. But Momentum Investing does  require discipline.

We email, text and tweet commentary on a daily and weekly basis. Below are commentaries previously posted.

***** THESE ARE SAMPLE PAGES & ARE NOT CURRENT ****

November 10, 2024

ATGL Top Pick of the Week Nov 10, 2024

UAA Chart
The Top Pink of the Week is Under Armour Inc. $UAA.

For busy investors that don’t have time to Swing Trade, we now have a simple Strategy: Top Pick of the Week. You Buy the “Pick” on Monday morning, and then Sell on Friday’s Close. This week:  UAA      UNDER ARMOUR INC.  to retest the recent high again.

This “Pick” will be emailed to you on Sunday, and we will track the performance weekly. If the stock exceeds the 15% target before Friday, it will be sold immediately to lock in profits. Otherwise, the stock is sold at Friday’s market close, regardless of the outcome (more details here). 

Below are the results for the Weekly Top Pick Performance.

During the week you can see the current Weekly Stock Pick Chart and Stock Pick.

______________________________________________________________________________

SWING TRADING (SHORT TERM)
Watchlist and Charts
Watch ListWatch List Charts
Current PositionsCurrent Charts
Closed ResultsTrading Dashboard
TOP PICK OF THE WEEK
Current Pick and Chart
Top Pick of the WeekFeatured Stock Chart

11/10/2024  Markets were sharply higher for the week after excitement from the Election results on Tuesday, and then FED cutting of short term Rates again on Wednesday. The major Indices Gapped Up on panic Buying and made new highs, but the Volume was not high (where are the big Buyers?

Markets are now very extended for the short term, so we have been taking profits as the Targets has been met. Remember, Smart Money Buys on Bad News, and Takes Profits on Good News.

Longer term the S&P 500, NASDAQ 100,  & DOW 30 are stretched Way above the Green Lines (and will meet again with the Green Lines). Markets can go higher, but Smart Money requires at least a 2:1 Reward / Risk ratio when Buying. Historically Buying in the weekly Red Zone above does not offer a 2:1 Reward /Risk (So have tight Sell Stops on your positions if you want to have Cash to Buy on the next FEAR Flush).  

We Buy the strongest Leaders that make new highs, on pull-backs. So follow the Green Line System and you should continue to win more than you lose.  SEE WATCH LIST

With the Green Line System, your Money should flow into the Strongest areas and your Account value should be able to grow in both Bull and Bear Markets. Follow the MONEY, not the MEDIA. 
______________________________________________________________________________

COMPLETED SWING TRADES THIS WEEK.

AAOI       APPLIED OPTO      Target was Hit at $19.44 for a 24.5 % Gain.    
GDX      GOLD MINING FUND         Stopped Out with a 4.21 Loss.  
IONQ       IONQ INC.      Target was Hit at $140 with a 9.6% Gain.     
ORCL      ORACLE INC.        Target was Hit as $178.52 for a 2.9 % Gain
QQQ       NASDAQ 100 FUND       The Target was Hit at $500.56 for a 1.6 % Gain.
TSLA       TESLA INC.    The Target was Hit at 284.67 for a 13.2 % Gain.     
VST       VISTRA ENERGY        Target was Hit with a 32.41 for a 19.8% Gain.
XLF       FINANCIAL FUND        Target was Hit at $49.04 for a 5 % Gain.
ZETA     ZETA GLOBAL        Target was Hit with a 32.41 for a 19.8% Gain.

Completed Swing Trades thru Oct. 2024:   241 Trades, + 958% Total.  Avg. Trade = 3.98 % Gain (before taxes and commissions).       
______________________________________________________________________________

For the week the Dow was up 4.68%, the S&P 500 was up 4.75% and the NASDAQ 100 was up 5.48%. The major Indices Gapped Up on panic Buying and made news highs, but some still have a Relative Strength below 80, so you should currently own the stronger Funds here. 

The Inflation Index (CRB) was up 0.80% for the week and is Above the Green Line, indicating Economic Expansion.
Bonds were up 1.82% for the week, and are Below the Green Line, indicating Economic Expansion.
The US DOLLAR was up 0.66% for the week and is Above the Green Line. 
Crude Oil was up 1.28% for the week at $70.38 and GOLD was down 1.98% at $2694.80.   

SEE SUPPLEMENTAL CHARTS

_______________________________________________________________________

DAY TRADERS: We are doing many profitable Day Trades on our Discord Trading Hub (free). Please join Discord or X (Twitter) with your cell phone app for the fastest Trade Alerts and Daily email notifications during the day. Other methods of notification have been too slow. Also, please check our our Live Trading Room on YouTube during Market hours.

_______________________________________________________________________
SWING TRADE BUYS SOON:

We are now in 3 Three Star logged Swing Trading Positions for the Short & Medium Term. There are only 2 investments on the Short Term Watch List. 

Be patient and WAIT for Green Zone Buy Signals!

______________________________________________________________________________

LONG TERM WATCH LIST

Watch List


ATGL Long Term Weekly Watchlist- Click here for scrolling charts.

UAA       UNDER ARMOUR INC. was Bought at $9.68 with High Volume, Target is $12.99.

Completed Long Term Trades thru Oct. 2024:  41 Trades, +249.37% Total, or 6.08% / Trade.       

______________________________________________________________________________

Important Links
Top 100Stage Chart InvestingCNN Fear & Greed Index
Dividend Growth PortfolioETF Sector PortfolioDogs of the Dow
Long Term StrategyStage Chart InvestingArticles

Alert! Market Risk is Medium (YELLOW). The probability of successful Short Term Trades is better, when the % of stocks above the 50-day avg. is below 20. 

Tell your Friends about the Green Line, and Help Animals.

______________________________________________________________________________

QUESTION:  Jose M writes “Morning, I seem to have difficulties on finding the Money Wave chart on the ETFs . Thanks.”

ANSWER:  The Charts and Money Waves can be pulled up by clicking on the Symbol of the Investment on the  Watch List  or PORTFOLIO links in every Daily Email Alert.

The Money Wave is the Red and Green Zone on the bottom part of the Chart (Same as Slow Stochastic). Buy when the Money Wave has gone down into the Green Zone, and then turns up above 20. A Black Arrow indicates a Money Wave Buy Signal.

Related Post

– ATGL Top Pick of the Week Nov 3, 2024

November 3, 2024

ATGL Top Pick of the Week Nov 3, 2024

Top Pick of the Week is Blue Owl Capital $OWL.

For busy investors that don’t have time to Swing Trade, we now have a simple Strategy: Top Pick of the Week. You Buy the “Pick” on Monday morning, and then Sell on Friday’s Close. This week:  OWL      BLUE OWL CAPITAL   to retest the recent high again.

This “Pick” will be emailed to you on Sunday, and we will track the performance weekly. If the stock exceeds the 15% target before Friday, it will be sold immediately to lock in profits. Otherwise, the stock is sold at Friday’s market close, regardless of the outcome (more details here). 

Below are the results for the Weekly Top Pick Performance.

WeeklyTPOW
The S&P 500 Fund (SPY) was down 0.8 % in October, and the 4 Top Picks of the Week Trades were up 6.4 %.

During the week you can see the current Weekly Stock Pick Chart and Stock Pick.

______________________________________________________________________________

SWING TRADING (SHORT TERM)
Watchlist and Charts
Watch ListWatch List Charts
Current PositionsCurrent Charts
Closed ResultsTrading Dashboard
TOP PICK OF THE WEEK
Current Pick and Chart
Top Pick of the WeekFeatured Stock Chart

11/3/2024  Markets were lower for the week and Bonds continued down from FED Printing (Inflation Fears). Bonds are now very over-sold, and would normally bounce soon. That should be Bullish for Stocks (lower long term Interest Rates). The DOW 30 & broad NYSE Indices are back down in the Green Zones for a probable bounce soon. Gold and Solver made new highs on FED Printing (Inflation Fears).

Longer term the S&P 500 & DOW 30 have corrected slightly off the highs, but are still stretched Way above the Green Lines (and will meet again with the Green Lines). Markets can go higher, but Smart Money requires at least a 2:1 Reward / Risk ratio when Buying. Historically Buying in the weekly Red Zone above does not offer a 2:1 Reward /Risk (So have tight Sell Stops on your positions if you want to have Cash to Buy on the next FEAR Flush).  

We Buy the strongest Leaders that make new highs, on pull-backs. So follow the Green Line System and you should continue to win more than you lose.  SEE WATCH LIST

With the Green Line System, your Money should flow into the Strongest areas and your Account value should be able to grow in both Bull and Bear Markets. Follow the MONEY, not the MEDIA. 
______________________________________________________________________________

COMPLETED SWING TRADES THIS WEEK.

ADMA       ADMA BIOLOGICS             Stopped Out at $19.75 for a 25.9 % Gain.     
BFLY      BUTTERFLY NETWORK        Target was Hit for an 18.3 % Gain.     
CIFR       CIPHER MINING        Stopped Out with a 2.86 % Gain.  
GOOGL       ALPHABET INC.       Stopped Out with a 3.97 % Loss.  
IREN      IRIS ENERGY        Stopped Out with a 23.94 % Loss. 
LUMN        LUMEN TECH.      Stopped Out at break even.   
NGD      NEW GOLD CORP.      Stopped Out at break even.   

Completed Swing Trades since Oct. 2024:   241 Trades, + 958% Total.  Avg. Trade = 3.98 % Gain (before taxes and commissions).       
______________________________________________________________________________

For the week the Dow was down 0.17%, the S&P 500 was down 1.38% and the NASDAQ 100 was down 1.59%. Many of the major Indices still have a Relative Strength below 80, so you should currently own the stronger Funds here. 

The Inflation Index (CRB) was down 1.84% for the week and is Below the Green Line, indicating Economic Contraction.
Bonds were down 1.08% for the week, and are Below the Green Line, indicating Economic Expansion.
The US DOLLAR was up 0.07% for the week and is Above the Green Line. 
Crude Oil was down 3.19% for the week at $69.49 and GOLD was down 0.20% at $2749.20 a new high.   

SEE SUPPLEMENTAL CHARTS

_______________________________________________________________________

DAY TRADERS: We are doing many profitable Day Trades on our Discord Trading Hub (free). Please join Discord or X (Twitter) with your cell phone app for the fastest Trade Alerts and Daily email notifications during the day. Other methods of notification have been too slow. Also, please check our our Live Trading Room on YouTube during Market hours.

_______________________________________________________________________
SWING TRADE BUYS SOON:

We are now in 5 Three Star logged Swing Trading Positions for the Short & Medium Term. There are 4 investments on the Short Term Watch List. 

Be patient and WAIT for Green Zone Buy Signals!

______________________________________________________________________________

LONG TERM WATCH LIST

Watch List


ATGL Long Term Weekly Watchlist- Click here for scrolling charts.

Completed Long Term Trades in Oct. 2024:  41 Trades, +249.37% Total, or 6.08% / Trade.       

______________________________________________________________________________

Important Links
Top 100Stage Chart InvestingCNN Fear & Greed Index
Dividend Growth PortfolioETF Sector PortfolioDogs of the Dow
Long Term StrategyStage Chart InvestingArticles

Alert! Market Risk is Medium (YELLOW). The probability of successful Short Term Trades is better, when the % of stocks above the 50-day avg. is below 20. 

Tell your Friends about the Green Line, and Help Animals.

______________________________________________________________________________

5 Ways to Get your Daily Money Wave Email & Trade Alerts:

    • Emailed to your box between 3:45 – 3:50 pm EST.
    • Website menu Commentary/Buy/Sell Signals
    • Discord Chat. and X (Twitter) @AboveGreenLine  are the fastest for Alerts (please set up “mobile notifications”)
    • Text messages: Email us your Cell number & phone carrier (slower results).

Thank you,

ATGL

Related Post

– ATGL Top Pick of the Week Oct 27, 2024

October 27, 2024

ATGL Top Pick of the Week Oct 27, 2024

UBER chart
The Top Pick of the Week is UBER Technologies $UBER.

For busy investors that don’t have time to Swing Trade, we now have a simple Strategy: Top Pick of the Week. You Buy the “Pick” on Monday morning, and then Sell on Friday’s Close. This week:  UBER      UBER TECHNOLOGIES    

This “Pick” will be emailed to you on Sunday, and we will track the performance weekly. If the stock exceeds the 15% target before Friday, it will be sold immediately to lock in profits. Otherwise, the stock is sold at Friday’s market close, regardless of the outcome (more details here). 

Below are the results for the Weekly Top Pick Performance.

During the week you can see the current Weekly Stock Pick Chart and Stock pick.

______________________________________________________________________________

SWING TRADING (SHORT TERM)
Watchlist and Charts
Watch ListWatch List Charts
Current PositionsCurrent Charts
Closed ResultsTrading Dashboard
TOP PICK OF THE WEEK
Current Pick and Chart
Top Pick of the WeekFeatured Stock Chart

10/27/2024  Markets were mostly lower for the week and Bonds continued down from FED Printing. Bonds are now very over-sold, and would normally bounce soon. That should be Bullish for Stocks (lower long term Interest Rates). The DOW 30 & broad NYSE Indices are back down in the Green Zones for a probable bounce soon. Semiconductors were slightly higher for the week, but are lagging the stronger Indices. Gold and Solver made new highs on FED Printing (Inflation Fears).

The S&P 500 & DOW 30 have corrected slightly off the highs, but are still stretched Way above the Green Lines (and will meet again with the Green Lines). Markets can go higher, but Smart Money requires at least a 2:1 Reward / Risk ratio when Buying. Historically Buying in the weekly Red Zone above does not offer a 2:1 Reward /Risk (So have tight Sell Stops on your positions if you want to have Cash to Buy on the next FEAR Flush).  

We Buy the strongest Leaders that make new highs, on pull-backs. So follow the Green Line System and you should continue to win more than you lose.  SEE WATCH LIST

With the Green Line System, your Money should flow into the Strongest areas and your Account value should be able to grow in both Bull and Bear Markets. Follow the MONEY, not the MEDIA. 
______________________________________________________________________________

COMPLETED SWING TRADES THIS WEEK.

AUR       AURORA INNOVATION       Target was Hit at $6.50 for a 17.1 % Gain.     
ASTS      AST SPACEMOBILE         Stopped Out at break even.  
LUMN        LUMEN TECH.      Target was Hit at $7.57 for an 17.73 % Gain.
RDFN      REDFIN CORP.       Stopped Out with a 19.55 % Loss.       
Z       ZILLOW GROUP      Stopped Out with a 6.16 % Loss.     

Completed Swing Trades since Sept. 2024:   191 Trades, 90 Wins, + 809% Total. Avg. Trade = 4.28 % Gain (before taxes and commissions).       
______________________________________________________________________________

For the week the Dow was down 2.66%, the S&P 500 was down 0.95% and the NASDAQ 100 was up 0.17. Many of the major Indices still have a Relative Strength below 80, so you should currently own the stronger Funds here. 

The Inflation Index (CRB) was up 1.84% for the week and is Above the Green Line, indicating Economic Expansion.
Bonds were down 0.56% for the week, and are Below the Green Line, indicating Economic Expansion.
The US DOLLAR was up 0.80% for the week and is Above the Green Line. 
Crude Oil was up 4.50% for the week at $71.78 and GOLD was up 0.90% at $2754.60 a new high.   

SEE SUPPLEMENTAL CHARTS

_______________________________________________________________________

DAY TRADERS: We are doing many profitable Day Trades on our Discord Trading Hub (free). Please join Discord or X (Twitter) with your cell phone app for the fastest Trade Alerts and Daily email notifications during the day. Other methods of notification have been too slow. Also, please check our our Live Trading Room on YouTube during Market hours.

_______________________________________________________________________
SWING TRADE BUYS SOON:

We are now in 7 Three Star logged Swing Trading Positions for the Short & Medium Term. There are 5 investments on the Short Term Watch List. 

Be patient and WAIT for Green Zone Buy Signals!

______________________________________________________________________________

LONG TERM WATCH LIST


ATGL Long Term Weekly Watchlist- Click here for scrolling charts.

Completed Long Term Trades in Sept. 2024:  35 Trades, 18 Wins +294.59% Total, or 8.42% / Trade.       

______________________________________________________________________________

Important Links
Top 100Stage Chart InvestingCNN Fear & Greed Index
Dividend Growth PortfolioETF Sector PortfolioDogs of the Dow
Long Term StrategyStage Chart InvestingArticles

Alert! Market Risk is Medium (YELLOW). The probability of successful Short Term Trades is better, when the % of stocks above the 50-day avg. is below 20. 

Tell your Friends about the Green Line, and Help Animals.

______________________________________________________________________________

QUESTION:  Janet writes: “I just signed up to your system.  I trade intraday so I need to know the following: 1) Indicators and their individual settings (Money Wave/Slow Stochastic), What time frame will I use on my charts for using this system intraday i.e., 5 minutes, 30 minutes?, 3) Do I still use the 250 EMA for trading intraday?”

ANSWER:  Hi Janet, and thank you for subscribing. We suggest you review the FAQ Page and the Rules.

We use 60-min and Daily Charts for most trades, and Weekly Charts for Longer Term trades.

Please read about Triple Buys to get into the Daily Buy Signal trades before the end of the day.

The Money Wave Indicator is a simple term for Slow Stochastic 5,1… All indicator values are labeled on each Chart.

Good trading, and tell your friends!

Related Post

– ATGL Top Pick of the Week! Oct 20, 2024

October 20, 2024

ATGL Top Pick of the Week! Oct 20, 2024

ONON chart
This week’s AGTL Top Pick of the Week: ON Holding AG ($ONON).

For busy investors that don’t have time to Swing Trade, we now have a simple Strategy: Top Pick of the Week. You Buy the “Pick” on Monday morning, and then Sell on Friday’s Close. This week:  ONON      ON HOLDING AG.    

This “Pick” will be emailed to you on Sunday, and we will track the performance weekly. If the stock exceeds the 15% target before Friday, it will be sold immediately to lock in profits. Otherwise, the stock is sold at Friday’s market close, regardless of the outcome (more details here). 

______________________________________________________________________________

SWING TRADING (SHORT TERM)
Watchlist and Charts
Watch ListWatch List Charts
Current PositionsCurrent Charts
Closed ResultsTrading Dashboard
TOP PICK OF THE WEEK
Current Pick and Chart
Top Pick of the WeekFeatured Stock Chart

10/20/2024  Markets were higher again for the week on lower Buying volume. There have been few Sellers so far, as many have FOMO (Fear of Missing Out), and don’t want to miss on possible larger Gains (HIGH GREED). We took profits on 5 Swing Trades this week (see below). Semiconductors were lower for the week, as the Techs see a possible slowing in the Economy. Gold and Solver made new highs on FED Printing (Inflation Fears).

The S&P 500 & DOW 30 are on new highs, but stretched Way above the Green Lines (and will meet again with the Green Lines). Markets can go higher, but Smart Money requires at least a 2:1 Reward / Risk ratio when Buying. Historically Buying in the weekly Red Zone above does not offer a 2:1 Reward /Risk (So have tight Sell Stops on your positions if you want to have Cash to Buy on the next FEAR Flush).  

We Buy the strongest Leaders that make new highs, on pull-backs. So follow the Green Line System and you should continue to win more than you lose.  SEE WATCH LIST

With the Green Line System, your Money should flow into the Strongest areas and your Account value should be able to grow in both Bull and Bear Markets. Follow the MONEY, not the MEDIA. 
______________________________________________________________________________

COMPLETED SWING TRADES THIS WEEK.

GDX      GOLD MINERS FUND      Target was Hit at $41.50 for a 4.1 % Gain.     
PCT      PURECYCLE TECH       Target was Hit at $10.25 for a 10.7 % Gain.     
WULF      TERAWULF INC.      Target was Hit at $5.25 for an 11.5 % Gain.
XLU      UTILITIES FUND      Target was Hit at $81.75 for a 1.9 % Gain.     
ZIM      ZIM SHIPPING      Raised Sell Stop to $23 for a 16.2 % Gain.     

CLSK, JMIA, & SVIX were moved to the Long Term Portfolio.

Completed Swing Trades in 2024:   191 Trades, 90 Wins, + 809% Total. Avg. Trade = 4.28 % Gain (before taxes and commissions).       
______________________________________________________________________________

For the week the Dow was up 0.95%, the S&P 500 was up 0.86% and the NASDAQ 100 was up 0,22There%. Many of the major Indices still have a Relative Strength below 80, so you should currently own the stronger Funds here. 

The Inflation Index (CRB) was down 3.99% for the week and is Below the Green Line, indicating Economic Contraction.
Bonds were down 1.94% for the week, and are Above the Green Line, indicating Economic Contraction.
The US DOLLAR was up 0.61% for the week and is Above the Green Line. 
Crude Oil was down 9.09% for the week at $68.69 and GOLD was up 2.01% at $2730.00 a new high.   

SEE SUPPLEMENTAL CHARTS

_______________________________________________________________________

DAY TRADERS: We are doing many profitable Day Trades on our Discord Trading Hub (free). Please join Discord or X (Twitter) with your cell phone app for the fastest Trade Alerts and Daily email notifications during the day. Other methods of notification have been too slow. Also, please check our our Live Trading Room on YouTube during Market hours.

_______________________________________________________________________
SWING TRADE BUYS SOON:

We are now in 7 Three Star logged Swing Trading Positions for the Short & Medium Term. There are 4 investments on the Short Term Watch List. 

Be patient and WAIT for Green Zone Buy Signals!

______________________________________________________________________________

LONG TERM WATCH LIST


ATGL Long Term Weekly Watchlist- Click here for scrolling charts.

ASHR      CHINA 300 FUND      Bought on the Daily Money Wave Close > 20. Target $35.
DOCU      DOCUSIGN INC.      Oct 15 Bought above $69.45 with High Volume. Target $90.     
HIMS       HIMS & HERS      Oct 15 Target was Hit at $22 for a 32.8 % Gain.     
MPC       MARATHON PETE    Oct 14 Stopped Out on the Close with a 10.2 % Loss.

Completed Long Term Trades in Sep 2024:  35 Trades, 18 Wins +294.59% Total, or 8.42% / Trade.       

______________________________________________________________________________

Important Links
Top 100Stage Chart InvestingCNN Fear & Greed Index
Dividend Growth PortfolioETF Sector PortfolioDogs of the Dow
Long Term StrategyStage Chart InvestingArticles

Alert! Market Risk is High (RED). The probability of successful Short Term Trades is better, when the % of stocks above the 50-day avg. is below 20. 

Tell your Friends about the Green Line, and Help Animals.

______________________________________________________________________________

QUESTION:  Jerry S. writes “How do I know when to Sell?”

ANSWER:  Hi Jerry.  Please follow the Rules for Selling below based on the Time Frame that you want to be in the Investment:

  1. Short Term: Sell when it Closes below the 10-day avg.
  2. Medium Term: Sell when it Closes below the 50-day avg.
  3. Long Term: Sell when it Closes below the Green Line (250-day avg).

Or Follow the Current Positions  (please click) on your daily emails.

Good trading, and tell your friends!

Related Post

– AGTL Top Pick of the Week! Oct 13, 2024

October 13, 2024

AGTL Top Pick of the Week! Oct 13, 2024

ITB chart
ATGL Top Pick of the Week is the Home Building Fund ($ITB).

For busy investors that don’t have time to Swing Trade, we now have a simple Strategy: Top Pick of the Week. You Buy the “Pick” on Monday morning, and then Sell on Friday’s Close. This week:  ITB     Home Building Fund.

This “Pick” will be emailed to you on Sunday, and we will track the performance weekly. If the stock exceeds the 15% target before Friday, it will be sold immediately to lock in profits. Otherwise, the stock is sold at Friday’s market close, regardless of the outcome (more details here). 

______________________________________________________________________________

SWING TRADING (SHORT TERM)
Watchlist and Charts
Watch ListWatch List Charts
Current PositionsCurrent Charts
Closed ResultsTrading Dashboard
TOP PICK OF THE WEEK
Current Pick and Chart
Top Pick of the WeekFeatured Stock Chart

10/13/2024  Markets were higher again for the week on lower Buying volume. So far there has been no profit taking after the Good News of the FED Printing again (cutting short term Interest Rates). Smart Money normally takes profits after Good News and Waits to Buy again on Bad News.

Bonds sold off more for the week on the FED Cut (Cut =Inflations worries =higher long term Interest Rates). But Bonds are now over-sold and are quickly back down to the Green Line for a probable bounce up soon. Normally Stocks would like falling Rates.

Markets can go higher, but Smart Money requires at least a 2:1 Reward / Risk ratio when Buying. Historically Buying in the Red Zone above does not offer a 2:1 Reward /Risk.  

We Buy the strongest Leaders that make new highs, on pull-backs. So follow the Green Line System and you should continue to win more than you lose.  SEE WATCH LIST

With the Green Line System, your Money should flow into the Strongest areas and your Account value should be able to grow in both Bull and Bear Markets. Follow the MONEY, not the MEDIA. 
______________________________________________________________________________

Completed Swing Trades in 2024:   191 Trades, 90 Wins, + 809% Total. Avg. Trade = 4.28 % Gain (before taxes and commissions).
______________________________________________________________________________

For the week the Dow was up 1.26%, the S&P 500 was up 1.15% and the NASDAQ 100 was up 1.24%. Many of the major Indices still have a Relative Strength below 80, so you should currently own the stronger Funds here. 

The Inflation Index (CRB) was down 0.23% for the week and is Above the Green Line, indicating Economic Expansion.
Bonds were down 1.94% for the week, and are Above the Green Line, indicating Economic Contraction.
The US DOLLAR was up 0.39% for the week and is Below the Green Line. 
Crude Oil was up 1.59% for the week at $75.56 and GOLD was up 0.32% at $2673.30.   

SEE SUPPLEMENTAL CHARTS

_______________________________________________________________________

DAY TRADERS: We are doing many profitable Day Trades on our Discord Trading Hub (free). Please join Discord or X (Twitter) with your cell phone app for the fastest Trade Alerts and Daily email notifications during the day. Other methods of notification have been too slow. Also, please check our our Live Trading Room on YouTube during Market hours.

_______________________________________________________________________
SWING TRADE BUYS SOON:

We are now in 7 Three Star logged Swing Trading Positions for the Short & Medium Term. There are 5 investments on the Short Term Watch List. 

Be patient and WAIT for Green Zone Buy Signals!

______________________________________________________________________________

LONG TERM WATCH LIST

Watch list

ATGL Long Term Weekly Watchlist- Click here for scrolling charts.

 Completed Long Term Trades in Sep 2024:  35 Trades, 18 Wins +294.59% Total, or 8.42% / Trade.

______________________________________________________________________________

Important Links
Top 100Stage Chart InvestingCNN Fear & Greed Index
Dividend Growth PortfolioETF Sector PortfolioDogs of the Dow
Long Term StrategyStage Chart InvestingArticles

Alert! Market Risk is High (RED). The probability of successful Short Term Trades is better, when the % of stocks above the 50-day avg. is below 20. 

Tell your Friends about the Green Line, and Help Animals.

______________________________________________________________________________

QUESTION:  Andrea writes “I have been a member for a month, and still quite confused on how to use the information and various tabs.   I assume one should only enter NEW TRADES so there is no confusion on goals and stop losses?

Please explain “Don’t take a loss”; do you mean make a tighter stop than the pink moving average, or  the suggested stop loss ?

ANSWER:  Hi Andrea. Yes, you should only do new trades.

Much of Investing is WAITING. Waiting for the Markets to return to the Green Zones.  70% of Stocks move with the Markets, so Buying a Stock when the S&P 500 is in the Red Zone is not a great bet. The best trades are when the S&P 500 is also in the Green Zone… it will happen.

When an Investment has a Buy Signal (Money Wave > 20) it should bounce up quickly… If the Money Wave > 50 and the Investment has not popped well, GET OUT.  Don’t Take a Loss!   Something might be wrong.  There will be many more trades… keep your Cash ready.

  • « Previous Page
  • 1
  • …
  • 4
  • 5
  • 6
  • 7
  • 8
  • …
  • 111
  • Next Page »

Subscribe to Our Newsletter

AGL Logo

Get our eBook Now!

Candlestick - A Swing Traders Friend

We don’t spam! Read our privacy policy for more info.

Check your inbox or spam folder to confirm your subscription.

Voted #1 at Stock Charts

SH Chart
Inverse S&P 500 Fund (SH) will have a Money Wave Buy today.

Help Us Help Animals

Help Us Help Animals

Recent Comments

  • AbovetheGreenLine on Green Line Weekly Aug 27, 2023
  • lbrodt on Green Line Weekly Aug 27, 2023
  • Mitch Van Zelfden on Money Wave Alert! Jul 31, 2023
  • AbovetheGreenLine on Money Wave Alert! Jul 31, 2023
  • Mitch Van Zelfden on Money Wave Alert! Jul 31, 2023

Become a Green Liner!

Help me make more Money in the Stock Market.

Investing with Rules.

On ATGL

  • DashBoard
  • Weekly Commentary
  • Daily Buy / Sell Signals
  • Day Trade Setup
  • Trading Rooms

Strategies

  • Swing Trading
  • ATGL Pick of the Week
  • Dividend Growth
  • ETF Sector Rotation
  • Dogs of the Dow

Help

  • ATGL Trading Rules
  • FAQ
  • Account Maintenance
  • Contact US
  • Join

Stay Updated

No credit card required. Unsubscribe anytime

Check your inbox or spam folder to confirm your subscription.

© 2024 Above The Green Line. All rights reserved.

  • Twitter
  • LinkedIn
  • YouTube