Markets popped up today, as the Indices recovered some of the losses from Thursday. The major Indices managed to hold or bounce at the Red Lines (50-day avgs), with the DOW Index holding up the best. The weaker Techs are trying to hold … [Read more...]
Money Wave Alert! Jun 29, 2017
Markets dumped today, as the Indices returned to the Red Lines (50-day avgs). The DOW Index is holding up the best, and the weaker Techs are trying to hold above the June Lows. S&P 500 has bounced at the Red Line (50-day avg.) around 2409, … [Read more...]
Money Wave Alert! Jun 28, 2017
Markets "Gapped Up" today, as the DOW Index was holding up very well, and the Techs bounced near the June Lows. S&P 500 closed below the Pink Line (10-day avg) yesterday to create selling. The target now is the Red Line (50-day … [Read more...]
Money Wave Alert! Jun 27, 2017
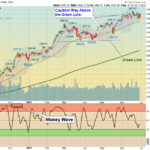
S&P 500 Hourly Chart Markets are down today, as the S&P 500 fell below the Pink Line (10-day avg) to create selling. The target now is the Red Line (50-day avg.) around 2408, where Buyers should come back in. The Techs … [Read more...]
Money Wave Alert! Jun 26, 2017
Markets "Gapped Up" on the opening, and then went negative for a while today. The Techs were up, buy many have Reversed down today. The NASDAQ 100 Index is going back up to re-test the mid June Highs, but it is already in the Red … [Read more...]
- « Previous Page
- 1
- …
- 399
- 400
- 401
- 402
- 403
- …
- 444
- Next Page »