• Market Insights
        • Commentary
          • Daily
          • Weekly
        • BUY / SELL SIGNALS
          • Trade Posts
          • Recent Trade Alerts
          • Recent Day Trades
        • BLOGROLL
          • Dividend Growth Blog
          • ETF Sector Blog
          • Dow Dogs
          • TPOW Blog
  • Strategies
        • SWING TRADING
          • Current Positions
          • Watchlists
          • Closed Positions
          • Candidates - TOP 100
          • Specialty Stocks
        • WEEKLY STOCK PICK
          • TPOW Charts
          • TPOW Performance
          • TPOW Strategy Guide
          • TPOW Performance Dashboard
        • DAY TRADING
          • Watch List
        • ATGL DASHBOARD
        • ETF STRATEGIES
          • ETF Sector Rotation
          • ETF Sector Portfolio
        • DIVIDEND GROWTH
          • Dividend Growth Portfolio
          • Dividend Calendar
        • DOGS OF THE DOW
          • Dogs of the Dow Portfolio
          • DOW 5 Portfolio
  • Markets
        • US MARKET
          • Commodities
          • Energy
          • Precious Metals
          • Volatility
        • GLOBAL MARKETS
          • Market Indices
          • Economic Calendar
          • FOREX Heat Map
          • FOREX Cross Rates
          • Crypto Currency Market
  • Investing
    • Discord Community
    • Dashboard
  • Resources
        • ARTICLES
          • Dividend Growth Model Articles
          • ETF Articles
          • Investment Strategies Articles
          • Market and Economic Insights
          • Stock Trade Articles
          • Stock Reviews
        • TOOLS
          • Stock Scanners
          • Charting Software
          • Brokerage Firms
        • STOCK CHARTS
          • Key Components
          • Reading Charts
          • Drawing Stock Charts
          • Identifying Trends
        • RETIREMENT PLANNING
  • About
    • Contact Us
    • How to Win
    • #1 At Stockcharts
    • Disclaimer
    • FAQ
  • Log In
  • Subscribe
Menu
  • Market Insights
    • Commentary
      • Daily
      • Weekly
    • BUY / SELL SIGNALS
      • Trade Posts
      • Recent Trade Alerts
      • Recent Day Trades
    • BLOGROLL
      • Dividend Growth Blog
      • ETF Sector Blog
      • Dow Dogs
      • TPOW Blog
  • Strategies
    • SWING TRADING
      • Current Positions
      • Watchlists
      • Closed Positions
      • Candidates – TOP 100
      • Specialty Stocks
    • DAY TRADING
      • Watch List
    • WEEKLY STOCK PICK
      • TPOW Charts
      • TPOW Performance
      • TPOW Strategy Guide
      • TPOW Performance Dashboard
    • DIVIDEND GROWTH
      • Dividend Growth Portfolio
      • Dividend Calendar
    • DOGS OF THE DOW
      • Dogs of the Dow Portfolio
      • DOW 5 Portfolio
    • ETF STRATEGIES
      • ETF Sector Rotation
      • ETF Sector Portfolio
    • ATGL DASHBOARD
  • Markets
    • US MARKET
      • Commodities
      • Energy
      • Precious Metals
      • Volatility
    • GLOBAL MARKETS
      • Market Indices
      • Economic Calendar
      • FOREX Heat Map
      • FOREX Cross Rates
      • Crypto Currency Market
  • Investing
    • Discord Community
    • Dashboard
  • Resources
    • ARTICLES
      • Dividend Growth Model Articles
      • ETF Articles
      • Investment Strategies Articles
      • Market and Economic Insights
      • Stock Trade Articles
      • Stock Reviews
    • TOOLS
      • Stock Scanners
      • Charting Software
      • Brokerage Firms
    • STOCK CHARTS
      • Key Components
      • Reading Charts
      • Drawing Stock Charts
      • Identifying Trends
    • RETIREMENT PLANNING
  • About
    • Contact Us
    • How to Win
    • #1 At Stockcharts
    • Disclaimer
    • FAQ
  • Log Out
    • Members-Page
    • Referral
  • Log In
  • Subscribe
Log In
Log Out
Subscribe

Buy / Sell Signals

April 2, 2024

Money Wave Alert! Apr 2, 2024

NVDA chart
NVIDIA Corp. ($NVDA) has pulled back down into the Green Zone.

SWING TRADING (SHORT TERM)
Watchlist and Charts

Watch ListWatch List Charts
Current PositionsCurrent Charts
Closed ResultsTrading Dashboard

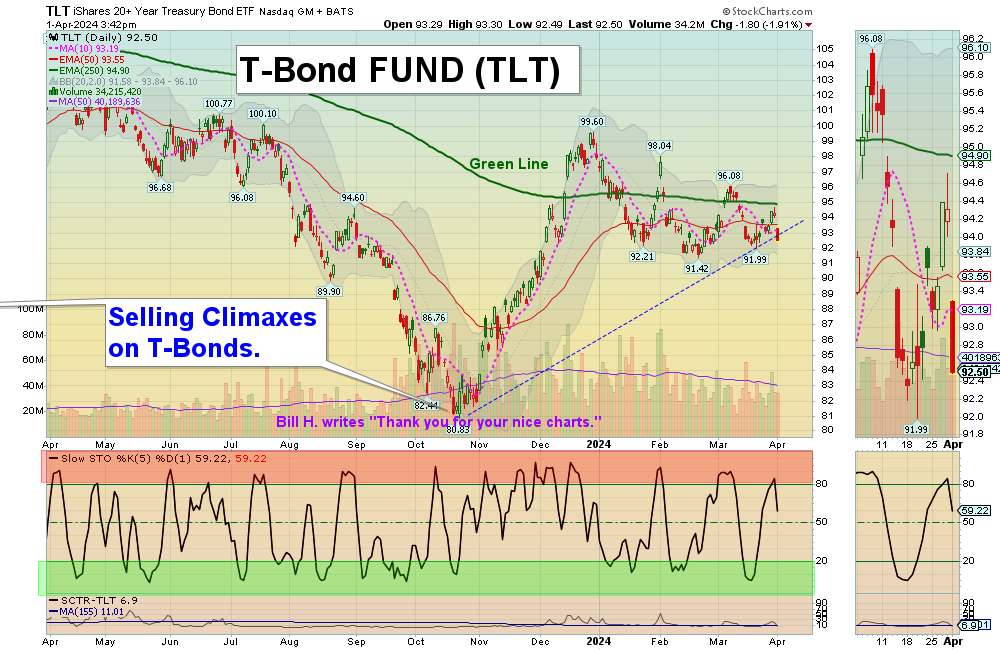
4/2/2024  Markets were lower again today as the Bonds dropped and long term Rates rose. The S&P 500 and DOW 30 Indices might close below the Pink Lines (10-day avgs.) for short term Sell Signals.

Very few Leaders are back on Highs with the S&P 500 Index, which could be Bearish. Bit-Coin Stocks made a lower high and dumped. (BITO & GBTC).

Wait for more Buy Signals soon, coming up out of the Green Zones.  CHARTS  The best moves happen when the S&P 500 Index is also coming up out of the Green Zone.  ______________________________________________________________________________

BUYS TODAY   4/2/2024             

ARDX      ARDELYX INC.      Swing trade Buy today, Target is $9.50. EXIT if it is going to Close below $7.09.

META      META PLATFORMS       Swing Trade Buy today, but the Volume was not High (2 Star trade).

NTNX      NUTANIX INC.         Swing Trade Buy today, but the Volume was not High (2 Star trade).

BUYS TOMORROW              

HIMS      HIMS & HERS HEALTH       Wait for Daily Money Wave Close > 20 with High Volume.   

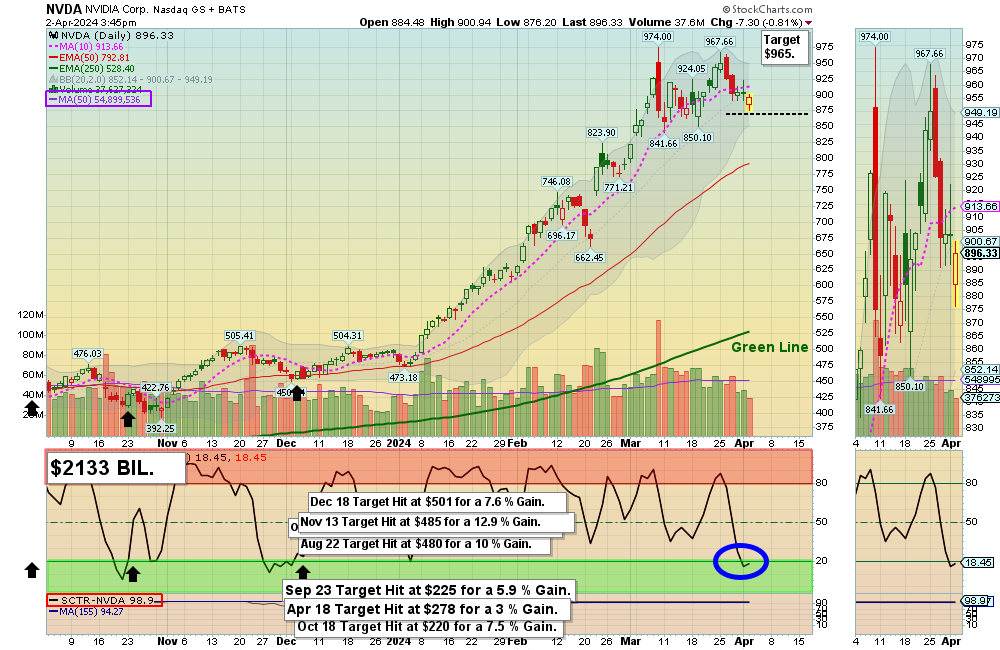
NVDA      NVIDIA CORP.      Wait for Daily Money Wave Close > 20 with High Volume.     

OCUL      OCULAR THERA.          Wait for Daily Money Wave Close > 20 with High Volume.

Shop for a better price earlier in the day with Triple Buy Signal, on the same day that a Daily Money Wave Buy Signal will occur.  

BUYS SOON                  

BVN      BUENAVISTA GOLD       Wait for Daily Money Wave Close > 20 with High Volume.

Please be patient and Wait for Money Wave Buy Signals.  We will email you when they are ready. Follow on the WATCH LIST.       

Many like to Buy the Swing Trades just before the Close, if the Money Wave is going to create a Buy Signal (Closing > 20 and up out of the Green Zone). Don’t Buy if the Security has already popped up too much. Money Wave Buy Signals are usually good for a 3-6 % move in a few days.

SELLS TODAY                 

CVNA      CARVANA CO.      EXIT if it is going to Close below the Pink Line around $86.66. The Target was already Hit at $87 for a 9.3% Gain.     

GBTC      GRAYSCALE BIT-COIN FUND       Slipped below the Buy Price and was Stopped Out.

IOVA      IOVANCE BIOTHERA.        Slipped below the Buy Price of $13.90 and was Stopped Out even.     

OSCR      OSCAR HEALTH.      EXIT if it is going to Close below the Pink Line around $14.04.

PLTR      PALANTIR TECH        Lower Sell Stop Loss below $22.40 until it bottoms. The Money Wave is back down in the Green Zone.

________________________________________________________________________

DAY TRADING SETUPS.  Today 3 trades for $540.00. Day Trading Alerts are now being sent out on our new Discord Site with Live Chatting. Please install Discord app on your pc or cell for mobile notifications.

Also follow our Trading Room for quick trades. Or look for Triple Buy Pops (3 Green Circles). Big Movers today:  TSLQ (+7%) SOXS (+7%) & UNG  (+6%).

Try out the Side by Side layout.       DAY TRADING FOR INDICES & LARGE CAPS CHARTS.

Bonds were down today and are Below the Green Line.  

Crude Oil was up $0.77 today at $83.94.

MY TRADING DASHBOARD 
SWING TRADING CURRENT POSITIONS
DAY TRADING SETUPS
TRADE ALERTS
STAGE CHART INVESTING
GREEN LINE CHARTS AT STOCKCHARTS
ARE YOUR INVESTMENTS ABOVE THE GREEN LINE?
GREEN LINE RULES
ETF SECTOR ROTATION SYSTEM   
New TOP 100 LIST Updated Mar 1, 2024  

* Safer Trades that meet ALL three criteria will be classified as 3 STAR, while trades that only meet two of the three criteria will be flagged as 2 STAR (more risk). 

Related Post

– ARDX

April 1, 2024

Money Wave Alert! Apr 1, 2024

TLT chart
Inflation Fears caused Bonds (TLT) to drop, and Interest Rates to rise.

SWING TRADING (SHORT TERM)
Watchlist and Charts

Watch ListWatch List Charts
Current PositionsCurrent Charts
Closed ResultsTrading Dashboard

4/1/2024  Markets were mostly lower today as the Bonds dropped and long term Rates rose. Many Techs were able to bounce up today, but the S&P 500 and DOW 30 Indices stalled out at the Highs.

Very few Leaders are back on Highs with the S&P 500 Index, which could be Bearish. Bit-Coin Stocks were are retesting last week’s High. (BITO & GBTC).

Wait for more Buy Signals soon, coming up out of the Green Zones.  CHARTS  The best moves happen when the S&P 500 Index is also coming up out of the Green Zone.  ______________________________________________________________________________

ETF SECTOR ROTATION SYSTEM  The 1st Quarter ended last Thursday and we Sold all 5 ETF Positions on the Close. The 5 new ETFs to Buy on the Close today, Monday Apr. 1st will be SPY – S&P 500 Fund, QQQ – NASDAQ 100 Fund, IWM – Small Cap Fund, XLF – Financial Fund, and XLE – Energy Fund. Or you can replace XRT & EFA with XLF & XLE on Monday’s Close and have 20% in each Fund for the monthly rotation.
______________________________________________________________________________

BUYS TODAY   4/1/2024             

JMIA      JUMIA TECH       Swing Trade Buy today, but the Volume was not High (2 Star trade).

BUYS TOMORROW              

ARDX      ARDELYX INC.      Wait for Daily Money Wave Close > 20 with High Volume.     

HIMS      HIMS & HERS HEALTH       Wait for Daily Money Wave Close > 20 with High Volume.

META      META PLATFORMS      Wait for Daily Money Wave Close > 20 with High Volume.

OCUL      OCULAR THERA.          Wait for Daily Money Wave Close > 20 with High Volume.

Shop for a better price earlier in the day with Triple Buy Signal, on the same day that a Daily Money Wave Buy Signal will occur.  

BUYS SOON                  

BVN      BUENAVISTA GOLD       Wait for Daily Money Wave Close > 20 with High Volume.

NTNX      NUTANIX INC.      Wait for Daily Money Wave Close > 20 with High Volume.

Please be patient and Wait for Money Wave Buy Signals.  We will email you when they are ready. Follow on the WATCH LIST.       

Many like to Buy the Swing Trades just before the Close, if the Money Wave is going to create a Buy Signal (Closing > 20 and up out of the Green Zone). Don’t Buy if the Security has already popped up too much. Money Wave Buy Signals are usually good for a 3-6 % move in a few days.

SELLS TODAY                 

CVNA      CARVANA CO.      EXIT if it is going to Close below the Pink Line around $86.46. The Target was already Hit at $87 for a 9.3% Gain.

PLTR      PALANTIR TECH        Lower Sell Stop Loss below $22.40 until it bottoms. The Money Wave is back down in the Green Zone.

________________________________________________________________________

DAY TRADING SETUPS.  Today 4 trades for $450.00. Day Trading Alerts are now being sent out on our new Discord Site with Live Chatting. Please install Discord app on your pc or cell for mobile notifications.

Also follow our Trading Room for quick trades. Or look for Triple Buy Pops (3 Green Circles). Big Movers today:  JMIA (+5%) SOXL (+5%) & UNG  (+6%).

Try out the Side by Side layout.       DAY TRADING FOR INDICES & LARGE CAPS CHARTS.

Bonds were down today and are Below the Green Line.  

Crude Oil was up $0.77 today at $83.94.

MY TRADING DASHBOARD 
SWING TRADING CURRENT POSITIONS
DAY TRADING SETUPS
TRADE ALERTS
STAGE CHART INVESTING
GREEN LINE CHARTS AT STOCKCHARTS
ARE YOUR INVESTMENTS ABOVE THE GREEN LINE?
GREEN LINE RULES
ETF SECTOR ROTATION SYSTEM   
New TOP 100 LIST Updated Mar 1, 2024  

* Safer Trades that meet ALL three criteria will be classified as 3 STAR, while trades that only meet two of the three criteria will be flagged as 2 STAR (more risk).   

Related Post

– JMIA

March 29, 2024

Financial Instruments: Types & Asset Classes.

By AbovetheGreenLine

Updated March 29, 2024

As an investor navigating the markets, you have access to a wide variety of trading instruments across different types and asset classes. This guide is designed to help you understand these instruments so you can make informed decisions that align with your investment goals and risk tolerance. Recognizing the range and functionalities of these trading instruments is fundamental to optimizing your portfolio’s performance.

What Are Considered Trading Instruments?

Trading instruments are the financial assets and contracts you can buy and sell in the markets. These are the tools you use to execute your investment strategies, and they range from owning shares in companies to trading derivatives for speculation or hedging. Each trading instrument offers unique opportunities and risks, serving as a crucial component of your investment approach to meet your financial aspirations.

The 8 Most Traded Types of Instruments You Should Know

Navigating the financial markets involves understanding the most commonly traded instruments. These instruments are both tools for investment as well as indicators of market health and investor sentiment. Here are the eight types of trading instruments every investor should be familiar with.

1. Stocks Representing Ownership in a Company

Stocks are perhaps the most well-known trading instruments. When you buy a stock, you’re purchasing a share of ownership in a company. This ownership stake entitles you to a portion of the company’s earnings and assets. Stocks are traded on stock exchanges and can provide significant returns through capital appreciation and dividends. However, they also come with risks, as the value of stocks can fluctuate widely based on the company’s performance and market conditions.

2. Exchange-Traded Funds (ETFs) Traded on Stock Exchanges

ETFs are investment funds traded on stock exchanges, much like stocks. They hold assets such as stocks, commodities, or bonds and generally operate with an arbitrage mechanism designed to keep the trading close to its net asset value, though deviations can occasionally occur. ETFs offer a cost-efficient way to gain exposure to a broad range of assets, allowing for diversification within your investment portfolio. They are popular among investors for their liquidity, flexibility, and ease of trading.

3. Contract for Difference (CFD) Based on Entry and Closing Prices

A Contract for Difference (CFD) is a derivative trading instrument that allows investors to speculate on the rising or falling prices of fast-moving global financial markets or instruments such as shares, indices, commodities, currencies, and treasuries. With a CFD, you don’t own the underlying asset but instead trade on the price movement, allowing for potential profits or losses from the difference between the entry and closing prices of the contract. CFDs offer leverage, meaning you can control a large position with a small amount of capital, but this also increases the risk, as losses can exceed deposits.

4. Futures Contracts for Buying or Selling Assets

Futures contracts are agreements to buy or sell a specific asset at a predetermined price on a future date. As an investor, you can use futures to speculate on the price movement of commodities, indices, or financial instruments without the need to own the underlying asset directly. These contracts can also serve as a valuable tool for hedging, allowing you to manage the risk associated with price fluctuations in your portfolio.

5. Options Contracts That Allow Put or Call Options

Options contracts provide you the right, but not the obligation, to buy (call options) or sell (put options) an underlying asset at a specified price before a certain date. This flexibility makes options a powerful instrument for both speculation and risk management. Whether you’re aiming to protect your investments from market downturns or to capitalize on anticipated price movements, options can offer strategic advantages to your trading approach.

6. Forward Contracts Used for Hedging and Risk Reduction

Forward contracts are customized agreements between two parties to buy or sell an asset at a future date for a price that is agreed upon today. Unlike futures, forward contracts are not traded on exchanges and are not standardized, offering you greater flexibility to tailor the terms to your specific risk management needs. Primarily used for hedging against price changes in currencies, commodities, and other assets, forwards can effectively secure prices and mitigate potential losses in your investment strategy.

7. Metals As Standalone Trading Instruments

Investing in metals allows you to diversify your portfolio beyond traditional financial instruments. Metals such as gold, silver, platinum, and palladium can be traded in various forms, including physical bars, coins, and through financial products like futures contracts and exchange-traded funds (ETFs). These commodities are valued as a hedge against inflation, currency devaluation, and economic uncertainties, making them a strategic choice for preserving wealth.

8. Currency Derivatives Most Commonly Used in Forex Trading

Currency derivatives, including options, futures, and forwards, are crucial instruments in the forex (foreign exchange) market. These contracts enable you to speculate on the movement of currency exchange rates or hedge against foreign exchange risk. Whether you’re managing international investments or seeking exposure to currency markets, understanding and utilizing currency derivatives can enhance your financial strategy’s effectiveness and protect against adverse movements in exchange rates.

What Are the Classes of Assets or Asset Baskets?

As you build and refine your investment portfolio, you’ll want to understand the different classes of assets or asset baskets available to you. These categories include:

  • Equities: When you invest in stocks, you buy company ownership shares. This asset class offers the potential for significant returns but comes with higher volatility and risk.
  • Fixed Income: By purchasing bonds, you’re lending money to issuers (corporations or governments) in exchange for regular interest payments and the return of the bond’s face value at maturity. Bonds are generally considered less risky than stocks, providing a steadier income stream.
  • Commodities: This class covers physical goods like metals, energy, and agricultural products. Investing in commodities can protect against inflation and diversify your portfolio.
  • Currencies: Trading in the forex market involves buying and selling different currencies. It’s a way to speculate on changes in exchange rates or hedge against currency risk in other investments.
  • Real Estate: Property investments can offer rental income and price appreciation. They can also be a hedge against inflation and a source of diversification.
  • Alternatives: This broad category includes hedge funds, private equity, and cryptocurrencies, offering unique risks and rewards not typically found in more traditional investments.

Discover the Best Trading Platform for Professional Traders

Professional traders require a platform that offers advanced analytical tools, a comprehensive range of trading instruments, and efficient execution. Finding a solution that supports your trading strategies with customizable charts, technical indicators, and real-time market data is crucial. Security, reliability, and responsive customer support are essential to ensure a seamless trading experience.

Elevate your trading with a platform tailored for professionals by exploring our memberships at Above the Green Line.

Related Post

– Money Wave Alert! Mar 28, 2024

March 28, 2024

Money Wave Alert! Mar 28, 2024

ETF chart
The ETF Sector Rotation System had a nice 1st Quarter.

SWING TRADING (SHORT TERM)
Watchlist and Charts

Watch ListWatch List Charts
Current PositionsCurrent Charts
Closed ResultsTrading Dashboard

MARKETS WILL BE CLOSED ON FRIDAY FOR EASTER HOLIDAY.

3/28/2024  Markets were mixed today on low Holiday trading. The S&P 500 and DOW 30 Indices are back on Highs, but the Techs are lagging. The ETF Sector Rotation System of the Top 5 ETFs had a nice 1st Quarter.

Very few Leaders are back on Highs with the S&P 500 Index, which could be Bearish. Bit-Coin Stocks were are retesting last week’s High. (BITO & GBTC).

Wait for more Buy Signals soon, coming up out of the Green Zones.  CHARTS  The best moves happen when the S&P 500 Index is also coming up out of the Green Zone.  ______________________________________________________________________________

ETF SECTOR ROTATION SYSTEM  The 1st Quarter will end today and we will Sell all 5 ETF Positions on the Close. The 5 new ETFs to Buy on Monday Apr. 1st will be SPY – S&P 500 Fund, QQQ – NASDAQ 100 Fund, IWM – Small Cap Fund, XLF – Financial Fund, and XLE – Energy Fund and should be bought on the Close Monday. Or you can replace XRT & EFA with XLF & XLE on Monday’s Close and have 20% in each Fund for the monthly rotation.
______________________________________________________________________________

BUYS TODAY   3/28/2024             

IBRX      IMMUNITYBIO INC.       Swing Trade Buy today, but the Volume was not High (2 Star trade).

M      MACY’S INC.      Swing Trade Buy today, but the Volume was not High (2 Star trade). 

MREO       MEREO BIOPHARMA.      Bought above $3.20, and then shot up 13%. AVOID.

SOUN      SOUNDHOUND AI      Wait for Daily Money Wave Close > 20 with High Volume.

BUYS TOMORROW              

ARDX      ARDELYX INC.      Wait for Daily Money Wave Close > 20 with High Volume.     

JMIA      JUMIA TECH      Wait for Daily Money Wave Close > 20 with High Volume.

Shop for a better price earlier in the day with Triple Buy Signal, on the same day that a Daily Money Wave Buy Signal will occur.  

BUYS SOON                  

NTNX      NUTANIX INC.      Money Wave must Close in the Green Zone.   TRIP      TRIPADVISOR

Please be patient and Wait for Money Wave Buy Signals.  We will email you when they are ready. Follow on the WATCH LIST.       

Many like to Buy the Swing Trades just before the Close, if the Money Wave is going to create a Buy Signal (Closing > 20 and up out of the Green Zone). Don’t Buy if the Security has already popped up too much. Money Wave Buy Signals are usually good for a 3-6 % move in a few days.

SELLS TODAY                  

TRIP      TRIPADVISOR      Closed below the Pink Line late yesterday for a 2.3% Gain.

________________________________________________________________________

DAY TRADING SETUPS.  Today 5 trades for $695.00. Day Trading Alerts are now being sent out on our new Discord Site with Live Chatting. Please install Discord app on your pc or cell for mobile notifications.

Also follow our Trading Room for quick trades. Or look for Triple Buy Pops (3 Green Circles). Big Movers today:  IOVA (+6%) MARA (+10%) & MREO  (+13%).

Try out the Side by Side layout.       DAY TRADING FOR INDICES & LARGE CAPS CHARTS.

Bonds were down today and are Below the Green Line.  

Crude Oil was up $1.71 today at $83.06.

MY TRADING DASHBOARD 
SWING TRADING CURRENT POSITIONS
DAY TRADING SETUPS
TRADE ALERTS
STAGE CHART INVESTING
GREEN LINE CHARTS AT STOCKCHARTS
ARE YOUR INVESTMENTS ABOVE THE GREEN LINE?
GREEN LINE RULES
ETF SECTOR ROTATION SYSTEM   
New TOP 100 LIST Updated Mar 1, 2024  

* Safer Trades that meet ALL three criteria will be classified as 3 STAR, while trades that only meet two of the three criteria will be flagged as 2 STAR (more risk).   


HAVE A NICE EASTER WEEKEND!

Related Post

– IBRX

March 27, 2024

Money Wave Alert! Mar 27, 2024

QQQ chart
The NASDAQ 100 Fund (QQQ) is still holding up above the Pink Line.

SWING TRADING (SHORT TERM)
Watchlist and Charts

Watch ListWatch List Charts
Current PositionsCurrent Charts
Closed ResultsTrading Dashboard

3/27/2024  Markets were mixed to higher today as the S&P 500 and NASDAQ 100 Indices are trying to finish mild corrections, and should pop up again soon. Many Leaders are coming down from the Red Zones (too late to Buy for the short term) for Buy Signals soon.

Very few Leaders are back on Highs, which could be Bearish. Bit-Coin Stocks were mixed today. (BITO & GBTC).

Wait for more Buy Signals soon, coming up out of the Green Zones.  CHARTS  The best moves happen when the S&P 500 Index is also coming up out of the Green Zone.  ______________________________________________________________________________

BUYS TODAY   3/27/2024     NONE TODAY        

BUYS TOMORROW              

ARDX      ARDELYX INC.      Wait for Daily Money Wave Close > 20 with High Volume.     

IBRX      IMMUNITYBIO INC.      Wait for Daily Money Wave Close > 20 with High Volume. 

JMIA      JUMIA TECH      Wait for Daily Money Wave Close > 20 with High Volume.

M      MACY’S INC.      Wait for Daily Money Wave Close > 20 with High Volume.

SOUN      SOUNDHOUND AI      Wait for Daily Money Wave Close > 20 with High Volume.

Shop for a better price earlier in the day with Triple Buy Signal, on the same day that a Daily Money Wave Buy Signal will occur.  

BUYS SOON                  

MREO       MEREO BIOPHARMA.      Buy above $3.20 with High Volume with a 3% Trailing Sell Stop Loss below it.   

NTNX      NUTANIX INC.      Money Wave must Close in the Green Zone.   

Please be patient and Wait for Money Wave Buy Signals.  We will email you when they are ready. Follow on the WATCH LIST.       

Many like to Buy the Swing Trades just before the Close, if the Money Wave is going to create a Buy Signal (Closing > 20 and up out of the Green Zone). Don’t Buy if the Security has already popped up too much. Money Wave Buy Signals are usually good for a 3-6 % move in a few days.

SELLS TODAY     NONE TODAY             

________________________________________________________________________

DAY TRADING SETUPS.  Today 4 trades for $720.00. Day Trading Alerts are now being sent out on our new Discord Site with Live Chatting. Please install Discord app on your pc or cell for mobile notifications.

Also follow our Trading Room for quick trades. Or look for Triple Buy Pops (3 Green Circles). Big Movers today:  JMIA (+6%) MARA (+10%) & PRCH  (+10%).

Try out the Side by Side layout.       DAY TRADING FOR INDICES & LARGE CAPS CHARTS.

Bonds were down today and are Below the Green Line.  

Crude Oil was up $0.04 today at $81.66.

MY TRADING DASHBOARD 
SWING TRADING CURRENT POSITIONS
DAY TRADING SETUPS
TRADE ALERTS
STAGE CHART INVESTING
GREEN LINE CHARTS AT STOCKCHARTS
ARE YOUR INVESTMENTS ABOVE THE GREEN LINE?
GREEN LINE RULES
ETF SECTOR ROTATION SYSTEM   
New TOP 100 LIST Updated Mar 1, 2024  

* Safer Trades that meet ALL three criteria will be classified as 3 STAR, while trades that only meet two of the three criteria will be flagged as 2 STAR (more risk).   

Related Post

– ARDX

  • « Previous Page
  • 1
  • …
  • 56
  • 57
  • 58
  • 59
  • 60
  • …
  • 444
  • Next Page »

Subscribe to Our Newsletter

AGL Logo

Get our eBook Now!

Candlestick - A Swing Traders Friend

We don’t spam! Read our privacy policy for more info.

Check your inbox or spam folder to confirm your subscription.

Voted #1 at Stock Charts

SH Chart
Inverse S&P 500 Fund (SH) will have a Money Wave Buy today.

Help Us Help Animals

Help Us Help Animals

Recent Comments

  • AbovetheGreenLine on Green Line Weekly Aug 27, 2023
  • lbrodt on Green Line Weekly Aug 27, 2023
  • Mitch Van Zelfden on Money Wave Alert! Jul 31, 2023
  • AbovetheGreenLine on Money Wave Alert! Jul 31, 2023
  • Mitch Van Zelfden on Money Wave Alert! Jul 31, 2023

Become a Green Liner!

Help me make more Money in the Stock Market.

Investing with Rules.

On ATGL

  • DashBoard
  • Weekly Commentary
  • Daily Buy / Sell Signals
  • Day Trade Setup
  • Trading Rooms

Strategies

  • Swing Trading
  • ATGL Pick of the Week
  • Dividend Growth
  • ETF Sector Rotation
  • Dogs of the Dow

Help

  • ATGL Trading Rules
  • FAQ
  • Account Maintenance
  • Contact US
  • Join

Stay Updated

No credit card required. Unsubscribe anytime

Check your inbox or spam folder to confirm your subscription.

© 2024 Above The Green Line. All rights reserved.

  • Twitter
  • LinkedIn
  • YouTube