• Market Insights
        • Commentary
          • Daily
          • Weekly
        • BUY / SELL SIGNALS
          • Trade Posts
          • Recent Trade Alerts
          • Recent Day Trades
        • BLOGROLL
          • Dividend Growth Blog
          • ETF Sector Blog
          • Dow Dogs
          • TPOW Blog
  • Strategies
        • SWING TRADING
          • Current Positions
          • Watchlists
          • Closed Positions
          • Candidates - TOP 100
          • Specialty Stocks
        • WEEKLY STOCK PICK
          • TPOW Charts
          • TPOW Performance
          • TPOW Strategy Guide
          • TPOW Performance Dashboard
        • DAY TRADING
          • Watch List
        • ATGL DASHBOARD
        • ETF STRATEGIES
          • ETF Sector Rotation
          • ETF Sector Portfolio
        • DIVIDEND GROWTH
          • Dividend Growth Portfolio
          • Dividend Calendar
        • DOGS OF THE DOW
          • Dogs of the Dow Portfolio
          • DOW 5 Portfolio
  • Markets
        • US MARKET
          • Commodities
          • Energy
          • Precious Metals
          • Volatility
        • GLOBAL MARKETS
          • Market Indices
          • Economic Calendar
          • FOREX Heat Map
          • FOREX Cross Rates
          • Crypto Currency Market
  • Investing
    • Discord Community
    • Dashboard
  • Resources
        • ARTICLES
          • Dividend Growth Model Articles
          • ETF Articles
          • Investment Strategies Articles
          • Market and Economic Insights
          • Stock Trade Articles
          • Stock Reviews
        • TOOLS
          • Stock Scanners
          • Charting Software
          • Brokerage Firms
        • STOCK CHARTS
          • Key Components
          • Reading Charts
          • Drawing Stock Charts
          • Identifying Trends
        • RETIREMENT PLANNING
  • About
    • Contact Us
    • How to Win
    • #1 At Stockcharts
    • Disclaimer
    • FAQ
  • Log In
  • Subscribe
Menu
  • Market Insights
    • Commentary
      • Daily
      • Weekly
    • BUY / SELL SIGNALS
      • Trade Posts
      • Recent Trade Alerts
      • Recent Day Trades
    • BLOGROLL
      • Dividend Growth Blog
      • ETF Sector Blog
      • Dow Dogs
      • TPOW Blog
  • Strategies
    • SWING TRADING
      • Current Positions
      • Watchlists
      • Closed Positions
      • Candidates – TOP 100
      • Specialty Stocks
    • DAY TRADING
      • Watch List
    • WEEKLY STOCK PICK
      • TPOW Charts
      • TPOW Performance
      • TPOW Strategy Guide
      • TPOW Performance Dashboard
    • DIVIDEND GROWTH
      • Dividend Growth Portfolio
      • Dividend Calendar
    • DOGS OF THE DOW
      • Dogs of the Dow Portfolio
      • DOW 5 Portfolio
    • ETF STRATEGIES
      • ETF Sector Rotation
      • ETF Sector Portfolio
    • ATGL DASHBOARD
  • Markets
    • US MARKET
      • Commodities
      • Energy
      • Precious Metals
      • Volatility
    • GLOBAL MARKETS
      • Market Indices
      • Economic Calendar
      • FOREX Heat Map
      • FOREX Cross Rates
      • Crypto Currency Market
  • Investing
    • Discord Community
    • Dashboard
  • Resources
    • ARTICLES
      • Dividend Growth Model Articles
      • ETF Articles
      • Investment Strategies Articles
      • Market and Economic Insights
      • Stock Trade Articles
      • Stock Reviews
    • TOOLS
      • Stock Scanners
      • Charting Software
      • Brokerage Firms
    • STOCK CHARTS
      • Key Components
      • Reading Charts
      • Drawing Stock Charts
      • Identifying Trends
    • RETIREMENT PLANNING
  • About
    • Contact Us
    • How to Win
    • #1 At Stockcharts
    • Disclaimer
    • FAQ
  • Log Out
    • Members-Page
    • Referral
  • Log In
  • Subscribe
Log In
Log Out
Subscribe

Buy / Sell Signals

May 16, 2024

Money Wave Alert! May 16, 2024

SPX chart
The S&P 500 60-minute chart stalled out today $SPX.

SWING TRADING (SHORT TERM)
Watchlist and Charts

Watch ListWatch List Charts
Current PositionsCurrent Charts
Closed ResultsTrading Dashboard

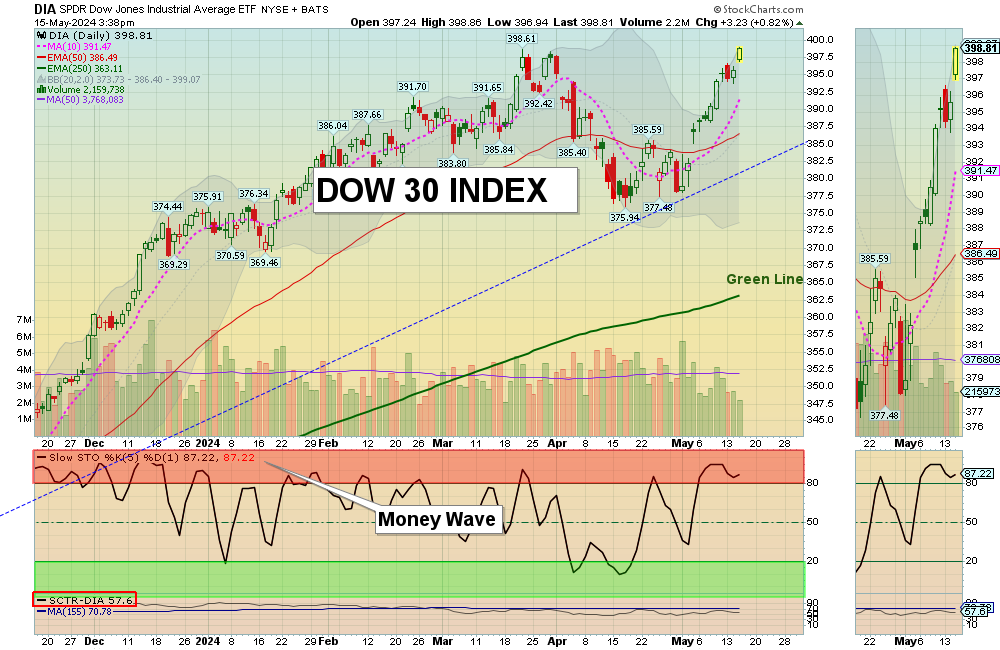
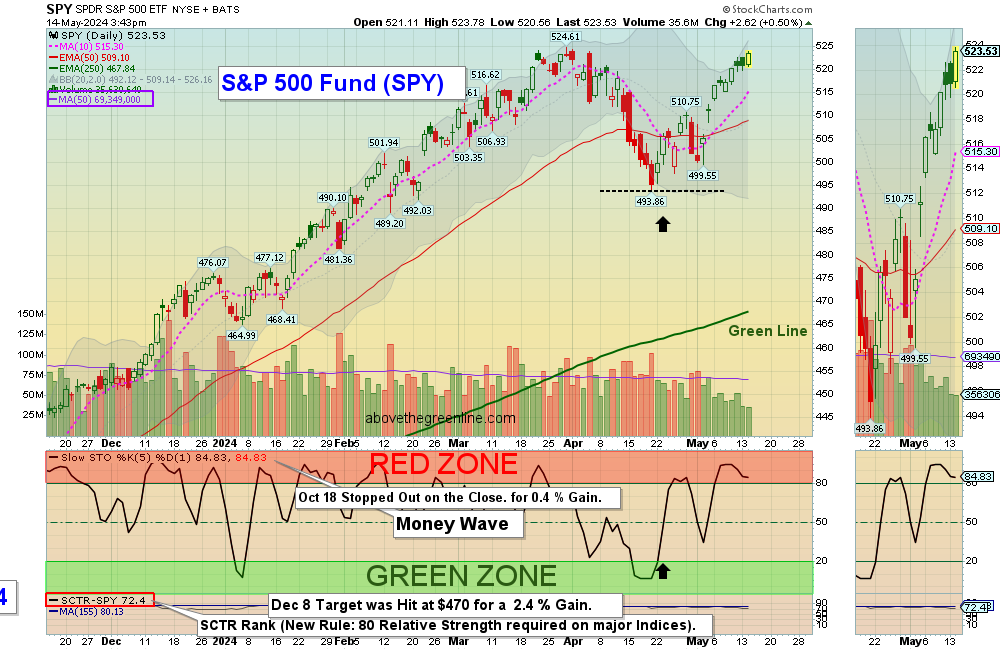
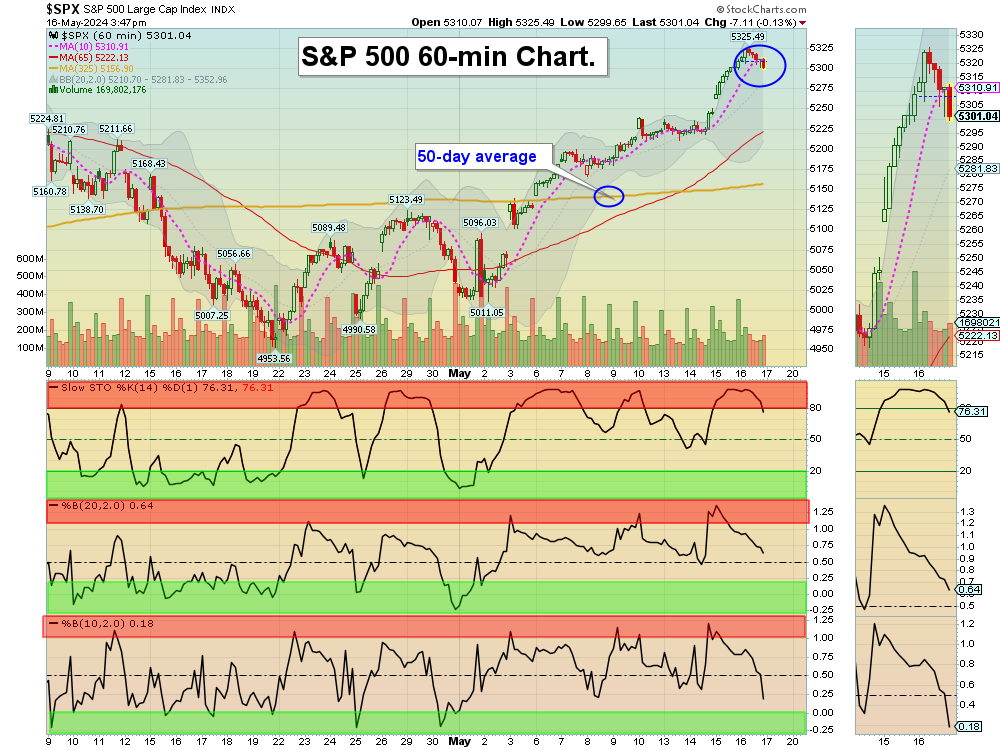
5/16/2024  Markets were mixed today after yesterday’s big gain. Bonds struggled, so the Markets had no fuel to go higher. The Leaders & Techs are up in the Red Zones (probably too late to Buy for the short term).  The GREED Index made another new high today, so be cautious in Buying now. Usually Smart Money takes profits when Greed is high.

Wait for more Buy Signals soon, coming up out of the Green Zones.  CHARTS  The best moves happen when the S&P 500 Index is also coming up out of the Green Zone.  ______________________________________________________________________________

BUYS TODAY   5/16/2024                     

GE      GENERAL ELECTRIC      Swing Trade Buy today, but the Volume was not high (2 Star trade).

BUYS TOMORROW               

SMMT      SUMMIT THERA.       Wait for Daily Money Wave Close > 20 with High Volume.   

Shop for a better price earlier in the day with Triple Buy Signal, on the same day that a Daily Money Wave Buy Signal will occur.  

BUYS SOON     NONE TODAY              

Please be patient and Wait for Money Wave Buy Signals.  We will email you when they are ready. Follow on the WATCH LIST.       

Many like to Buy the Swing Trades just before the Close, if the Money Wave is going to create a Buy Signal (Closing > 20 and up out of the Green Zone). Don’t Buy if the Security has already popped up too much. Money Wave Buy Signals are usually good for a 3-6 % move in a few days.

SELL TODAY  

HOOD      ROBINHOOD MKTS.      Target was Hit at $19 for a 5.4 % Gain.

________________________________________________________________________

DAY TRADING SETUPS.  Today 3 trades for $380.00. Day Trading Alerts are now being sent ou The t on our new Discord Site with Live Chatting. Please install Discord app on your pc or cell for mobile notifications.

Also follow our Trading Room for quick trades. Or look for Triple Buy Pops (3 Green Circles). Big Movers today:  JMIA (+5%) UNG (+5%) & HOOD (+6%).

Try out the Side by Side layout.       DAY TRADING FOR INDICES & LARGE CAPS CHARTS.

Bonds were down today and are Below the Green Line.  

Crude Oil was up $0.68 today at $79.32.

MY TRADING DASHBOARD 
SWING TRADING CURRENT POSITIONS
DAY TRADING SETUPS
TRADE ALERTS
STAGE CHART INVESTING
GREEN LINE CHARTS AT STOCKCHARTS
ARE YOUR INVESTMENTS ABOVE THE GREEN LINE?
GREEN LINE RULES
ETF SECTOR ROTATION SYSTEM   
New TOP 100 LIST Updated May 1, 2024  

* Safer Trades that meet ALL three criteria will be classified as 3 STAR, while trades that only meet two of the three criteria will be flagged as 2 STAR (more risk).   

Related Post

– GE

May 15, 2024

Money Wave Alert! May 15, 2024

DIA chart
The DOW 30 Index $DIA was able to make a higher high, on low Volume.

SWING TRADING (SHORT TERM)
Watchlist and Charts

Watch ListWatch List Charts
Current PositionsCurrent Charts
Closed ResultsTrading Dashboard

5/15/2024  Markets Gapped Up higher today, as the MEDIA told us that 3.4 % Inflation was Good News. Several Indices were able to make higher highs than March. Bonds were stronger, but the Leaders & Techs are not coming down from the Red Zones (probably too late to Buy for the short term).  The GREED Index made another new high today, so be cautious in Buying now. Usually Smart Money takes profits when Greed is high.

Wait for more Buy Signals soon, coming up out of the Green Zones.  CHARTS  The best moves happen when the S&P 500 Index is also coming up out of the Green Zone.  ______________________________________________________________________________

BUYS TODAY   5/15/2024                     

COIN      COINBASE GLOBAL      Swing Trade Buy today, but it is already up 7 % today (2 Star trade).

GERN      GERON CORP.        Swing Trade Buy today, but the Volume was not high (2 Star trade).

SNAP      SNAP INC.         Swing Trade Buy today, but the Volume was not high (2 Star trade).

BUYS TOMORROW               

GE      GENERAL ELECTRIC        Wait for Daily Money Wave Close > 20 with High Volume.   

Shop for a better price earlier in the day with Triple Buy Signal, on the same day that a Daily Money Wave Buy Signal will occur.  

BUYS SOON                   

GEO      GEO GROUP      Relative Strength is now below 90, AVOID.     

Please be patient and Wait for Money Wave Buy Signals.  We will email you when they are ready. Follow on the WATCH LIST.       

Many like to Buy the Swing Trades just before the Close, if the Money Wave is going to create a Buy Signal (Closing > 20 and up out of the Green Zone). Don’t Buy if the Security has already popped up too much. Money Wave Buy Signals are usually good for a 3-6 % move in a few days.

SELLS TODAY      

DB      DEUTSCHE BANK      Target was Hit at $17.50 for s 6.3 % Gain.     

HMY      HARMONY GOLD      Target was Hit at $9.50 for a 6.3% Gain

________________________________________________________________________

DAY TRADING SETUPS.  Today 5 trades for $520.00. Day Trading Alerts are now being sent ou The t on our new Discord Site with Live Chatting. Please install Discord app on your pc or cell for mobile notifications.

Also follow our Trading Room for quick trades. Or look for Triple Buy Pops (3 Green Circles). Big Movers today:  MSTR (+14%) DELL (+11%) & OCUL (+6%).

Try out the Side by Side layout.       DAY TRADING FOR INDICES & LARGE CAPS CHARTS.

Bonds were up today and are Below the Green Line.  

Crude Oil was up $1.03 today at $78.82.

MY TRADING DASHBOARD 
SWING TRADING CURRENT POSITIONS
DAY TRADING SETUPS
TRADE ALERTS
STAGE CHART INVESTING
GREEN LINE CHARTS AT STOCKCHARTS
ARE YOUR INVESTMENTS ABOVE THE GREEN LINE?
GREEN LINE RULES
ETF SECTOR ROTATION SYSTEM   
New TOP 100 LIST Updated May 1, 2024  

* Safer Trades that meet ALL three criteria will be classified as 3 STAR, while trades that only meet two of the three criteria will be flagged as 2 STAR (more risk).     

Related Post

– COIN

May 14, 2024

Money Wave Alert! May 14, 2024

SPY chart
The S&P 500 Index $SPY is getting back up near the March High.

SWING TRADING (SHORT TERM)
Watchlist and Charts

Watch ListWatch List Charts
Current PositionsCurrent Charts
Closed ResultsTrading Dashboard

5/14/2024  Markets were higher today, and the stronger S&P 500 Index was able to go higher than on Monday. Bonds were stronger, and the Indices are trying to go higher than in March, The Leaders & Techs are not coming down from the Red Zones (probably too late to Buy for the short term).  The GREED Index made another new high today, so be cautious in Buying now. Usually Smart Money takes profits when Greed is high.

Wait for more Buy Signals soon, coming up out of the Green Zones.  CHARTS  The best moves happen when the S&P 500 Index is also coming up out of the Green Zone.  ______________________________________________________________________________

BUYS TODAY   5/14/2024                     

HOOD      ROBINHOOD MKTS.     Swing Trade Buy today, but it is already up 6 % today (2 Star trade).

BUYS TOMORROW               

COIN      COINBASE GLOBAL       Wait for Daily Money Wave Close > 20 with High Volume.     

GE      GENERAL ELECTRIC        Wait for Daily Money Wave Close > 20 with High Volume. 

SNAP      SNAP INC.      Wait for Daily Money Wave Close > 20 with High Volume.      

Shop for a better price earlier in the day with Triple Buy Signal, on the same day that a Daily Money Wave Buy Signal will occur.  

BUYS SOON                   

GEO      GEO GROUP      Money Wave Must Close in the Green Zone.   

GERN      GERON CORP.      Money Wave Must Close in the Green Zone. 

Please be patient and Wait for Money Wave Buy Signals.  We will email you when they are ready. Follow on the WATCH LIST.       

Many like to Buy the Swing Trades just before the Close, if the Money Wave is going to create a Buy Signal (Closing > 20 and up out of the Green Zone). Don’t Buy if the Security has already popped up too much. Money Wave Buy Signals are usually good for a 3-6 % move in a few days.

SELLS TODAY      NONE TODAY

________________________________________________________________________

DAY TRADING SETUPS.  Today 5 trades for $570.00. Day Trading Alerts are now being sent ou The t on our new Discord Site with Live Chatting. Please install Discord app on your pc or cell for mobile notifications.

Also follow our Trading Room for quick trades. Or look for Triple Buy Pops (3 Green Circles). Big Movers today:  HIMS (+7%) OCUL (+8%) & HOOD (+10%).

Try out the Side by Side layout.       DAY TRADING FOR INDICES & LARGE CAPS CHARTS.

Bonds were up today and are Below the Green Line.  

Crude Oil was down $1.07 today at $78.05.

MY TRADING DASHBOARD 
SWING TRADING CURRENT POSITIONS
DAY TRADING SETUPS
TRADE ALERTS
STAGE CHART INVESTING
GREEN LINE CHARTS AT STOCKCHARTS
ARE YOUR INVESTMENTS ABOVE THE GREEN LINE?
GREEN LINE RULES
ETF SECTOR ROTATION SYSTEM   
New TOP 100 LIST Updated May 1, 2024  

* Safer Trades that meet ALL three criteria will be classified as 3 STAR, while trades that only meet two of the three criteria will be flagged as 2 STAR (more risk).     

Related Post

– HOOD

May 13, 2024

Money Wave Alert! May 13, 2024

IBRX ChRT
Swing Trade Buy today on ImmunityBio $IBRX for a quick bounce,

SWING TRADING (SHORT TERM)
Watchlist and Charts

Watch ListWatch List Charts
Current PositionsCurrent Charts
Closed ResultsTrading Dashboard

5/13/2024  Markets were slightly lower again today, and the stronger S&P 500 Index was not able to go higher than yesterday. Bonds were weaker, and the Leaders & Techs are still coming down from the Red Zones (probably too late to Buy for the short term).  The GREED Index made another new high today, so be cautious in Buying now. Usually Smart Money takes profits when Greed is high.

Wait for more Buy Signals soon, coming up out of the Green Zones.  CHARTS  The best moves happen when the S&P 500 Index is also coming up out of the Green Zone.  ______________________________________________________________________________

BUYS TODAY   5/13/2024                     

IBRX      IMMUNITY BIO      Swing Trade Buy today, but it is already up 7 % today (2 Star trade).

BUYS TOMORROW               

COIN      COINBASE GLOBAL       Wait for Daily Money Wave Close > 20 with High Volume.

HOOD      ROBINHOOD MKTS.       Wait for Daily Money Wave Close > 20 with High Volume.

SNAP      SNAP INC.      Wait for Daily Money Wave Close > 20 with High Volume.      

Shop for a better price earlier in the day with Triple Buy Signal, on the same day that a Daily Money Wave Buy Signal will occur.  

BUYS SOON                   

GEO      GEO GROUP      Money Wave Must Close in the Green Zone.    SNAP      SNAP INC.

GERN      GERON CORP.      Money Wave Must Close in the Green Zone. 

Please be patient and Wait for Money Wave Buy Signals.  We will email you when they are ready. Follow on the WATCH LIST.       

Many like to Buy the Swing Trades just before the Close, if the Money Wave is going to create a Buy Signal (Closing > 20 and up out of the Green Zone). Don’t Buy if the Security has already popped up too much. Money Wave Buy Signals are usually good for a 3-6 % move in a few days.

SELLS TODAY      

BVN       BUENAVENTURA GOLD        EXIT if it is going to Close below the Pink Line around $17.12. The Target was already Hit at $17.50 for an 8 % Gain.

XLF      FINANCIAL FUND       The Target was Hit at $42 for 3.6 % Gain.

________________________________________________________________________

DAY TRADING SETUPS.  Today 5 trades for $731.00. Day Trading Alerts are now being sent ou The t on our new Discord Site with Live Chatting. Please install Discord app on your pc or cell for mobile notifications.

Also follow our Trading Room for quick trades. Or look for Triple Buy Pops (3 Green Circles). Big Movers today:  SOUN (+9%) IBRX (+8%) & HOOD (+6%).

Try out the Side by Side layout.       DAY TRADING FOR INDICES & LARGE CAPS CHARTS.

Bonds were down today and are Below the Green Line.  

Crude Oil was up $1.01 today at $79.27.

MY TRADING DASHBOARD 
SWING TRADING CURRENT POSITIONS
DAY TRADING SETUPS
TRADE ALERTS
STAGE CHART INVESTING
GREEN LINE CHARTS AT STOCKCHARTS
ARE YOUR INVESTMENTS ABOVE THE GREEN LINE?
GREEN LINE RULES
ETF SECTOR ROTATION SYSTEM   
New TOP 100 LIST Updated May 1, 2024  

* Safer Trades that meet ALL three criteria will be classified as 3 STAR, while trades that only meet two of the three criteria will be flagged as 2 STAR (more risk).     

Related Post

– IBRX

May 11, 2024

Short Selling and Hedging

Strategies that capitalize on the decline of security prices are as vital as those betting on their rise. Two prominent bearish strategies are short selling and purchasing put options. Both approaches offer investors a pathway to profit from a downturn in stock prices, yet they operate on fundamentally different principles and entail distinct risk profiles. This article delves into the nuances of short selling vs puts, providing investors with a comprehensive understanding of these options to navigate bear markets effectively.

Bearish Strategies Explained

What Is Short Selling and How Does It Work?

Short selling is an investment strategy used by investors who anticipate a decline in the price of a stock or other securities. It involves borrowing shares from a broker and selling them on the open market at their current price. The investor then aims to buy back the same number of shares at a lower price in the future. If successful, the investor returns the borrowed shares to the broker, keeping the difference in price as profit.

The process of short selling is encapsulated in the formula: Profit = Selling Price – Buying Price.

For instance, if an investor shorts 100 shares of a company at $50 each and later buys them back at $40 each, the profit would be $(50 – 40) * 100 = $1,000.

However, short selling is accompanied by substantial risks. Since the potential rise in stock prices is unlimited, so is the potential loss for the investor. If the stock price increases, buying back the shares to return them to the broker will be more expensive, resulting in a loss for the short seller. Moreover, the investor is responsible for any dividends paid out while the shares are borrowed, adding to the trade cost.

What Are Put Options and How Do They Work?

Put options offer an alternative method for investors to speculate on the decline of a stock’s price, with potentially lower risk compared to short selling. A put option is a contract that gives the holder the right, but not the obligation, to sell a specified amount of an underlying asset at a predetermined price (strike price) within a specified timeframe.

The buyer of a put option pays a premium to the seller for this right. If the stock price falls below the strike price before the option expires, the holder can exercise the option to sell the stock at the strike price, purchasing the shares at the lower market price to realize a profit. The maximum profit achievable is limited to the strike price minus the cost of the option premium, should the stock price drop to zero.

The calculation for profit in a put option scenario is: Profit = Strike Price – Current Market Price – Premium Paid.

For example, if an investor purchases a put option with a strike price of $50 for a premium of $2 per share, and the stock price falls to $30, the profit would be $(50 – 30 – 2) * 100 = $1,800, assuming the contract covers 100 shares.

Put options provide investors with a way to profit from a stock’s decline without the need to borrow shares. The risk is limited to the premium paid for the option, making it a potentially less risky strategy than short selling. Additionally, put options can serve as a form of insurance for investors looking to hedge against potential losses in their portfolio.

Short Selling vs Puts: A Full Comparison

While short selling and purchasing put options offer investors strategies for profiting from a downturn in security prices, they differ significantly in execution, risk, and potential outcomes. This section provides a detailed comparison of these two strategies across various dimensions.

Underlying Asset Types

Short Selling: This strategy is predominantly used with stocks, although it can be applied to other asset types, such as bonds and commodities. The investor needs access to a brokerage that allows short selling and must have a margin account due to the inherent risks and borrowing involved.

Put Options: Put options can be bought for a broader range of assets, including stocks, indexes, and ETFs (Exchange-Traded Funds). This gives investors greater flexibility to speculate on or hedge against the decline in prices of various market segments.

Level of Risk and Profit Potential

Short Selling: The risk involved in short selling is theoretically unlimited, as there is no cap on how high a stock price can rise. Consequently, the potential loss can exceed the initial investment. However, the profit potential is also substantial; the asset’s price declines more as profits increase.

Put Options: The risk in buying put options is limited to the premium paid for the option. No matter how unfavorably the market moves against the position, the maximum loss is the cost of the option. The profit potential, while significant, is capped by the fact that an asset can only decrease to zero in value.

Volatility and Implied Volatility

Short Selling: Volatility can significantly impact short selling, with higher volatility increasing the risk of loss. Rapid price increases can lead to margin calls, requiring the investor to provide additional funds or close positions at a loss.

Put Options: Implied volatility—a measure of the market’s forecast of a likely movement in a security’s price—directly affects the cost of put options. Higher implied volatility typically increases option premiums, making put options more expensive and potentially reducing the strategy’s profitability.

Market Conditions

Short Selling: Short selling is most effective in bear markets or when a specific stock is expected to decline due to fundamental issues. However, it requires precise timing and close monitoring to avoid significant losses.

Put Options: Put options can be advantageous in both bear markets and volatile markets. They allow investors to profit from declines without needing to time the market perfectly, thanks to the predefined contract duration.

Liquidity and Execution

Short Selling: Executing a short sale requires finding a broker that has the shares to borrow, which can sometimes be challenging, especially for less liquid stocks. Execution speed and the ability to find shares can significantly impact the strategy’s success.

Put Options: Trading put options typically offers higher liquidity, especially for options on widely traded stocks and indexes. Execution is straightforward, as it involves purchasing contracts on the open market without the need for borrowing.

Costs and Time Decay

Short Selling: The costs involved include the borrowing fee (which varies based on the stock’s availability and demand) and interest on the margin account used to initiate the short sale. There is no time decay in short selling, but holding a position for a long time can increase costs significantly due to accruing interest.

Put Options: Besides the premium paid for the option, put options are subject to time decay (theta), meaning the value of the option decreases as it approaches expiration. This decay accelerates as the expiration date nears, making timing a crucial element in the strategy’s profitability.

Surpass Your Investment Objectives With Above the Green Line

Incorporating these strategies into your investment portfolio can offer valuable opportunities for profit and risk management in volatile or declining markets. However, a successful application demands in-depth knowledge, experience, and ongoing market analysis.

At Above the Green Line, we empower investors with the insights, tools, and strategies needed to navigate the complexities of the financial markets confidently. Our proprietary metrics and systematic models are designed to identify optimal buying and selling points, helping you optimize the timing of your trades and align with prevailing market trends. Whether your investment philosophy leans towards active trading or long-term holding, our resources can enhance your strategy’s effectiveness and help you achieve your investment objectives.

Unlock your investment potential and join a community of savvy investors today.

Related Post

– Money Wave Alert! May 10, 2024

  • « Previous Page
  • 1
  • …
  • 49
  • 50
  • 51
  • 52
  • 53
  • …
  • 444
  • Next Page »

Subscribe to Our Newsletter

AGL Logo

Get our eBook Now!

Candlestick - A Swing Traders Friend

We don’t spam! Read our privacy policy for more info.

Check your inbox or spam folder to confirm your subscription.

Voted #1 at Stock Charts

SH Chart
Inverse S&P 500 Fund (SH) will have a Money Wave Buy today.

Help Us Help Animals

Help Us Help Animals

Recent Comments

  • AbovetheGreenLine on Green Line Weekly Aug 27, 2023
  • lbrodt on Green Line Weekly Aug 27, 2023
  • Mitch Van Zelfden on Money Wave Alert! Jul 31, 2023
  • AbovetheGreenLine on Money Wave Alert! Jul 31, 2023
  • Mitch Van Zelfden on Money Wave Alert! Jul 31, 2023

Become a Green Liner!

Help me make more Money in the Stock Market.

Investing with Rules.

On ATGL

  • DashBoard
  • Weekly Commentary
  • Daily Buy / Sell Signals
  • Day Trade Setup
  • Trading Rooms

Strategies

  • Swing Trading
  • ATGL Pick of the Week
  • Dividend Growth
  • ETF Sector Rotation
  • Dogs of the Dow

Help

  • ATGL Trading Rules
  • FAQ
  • Account Maintenance
  • Contact US
  • Join

Stay Updated

No credit card required. Unsubscribe anytime

Check your inbox or spam folder to confirm your subscription.

© 2024 Above The Green Line. All rights reserved.

  • Twitter
  • LinkedIn
  • YouTube