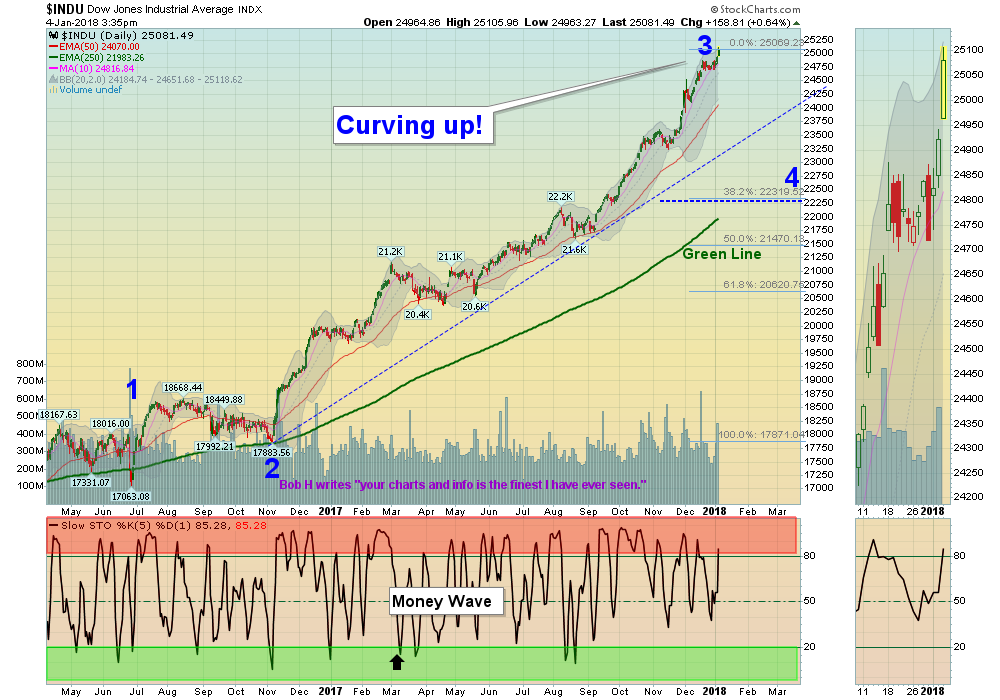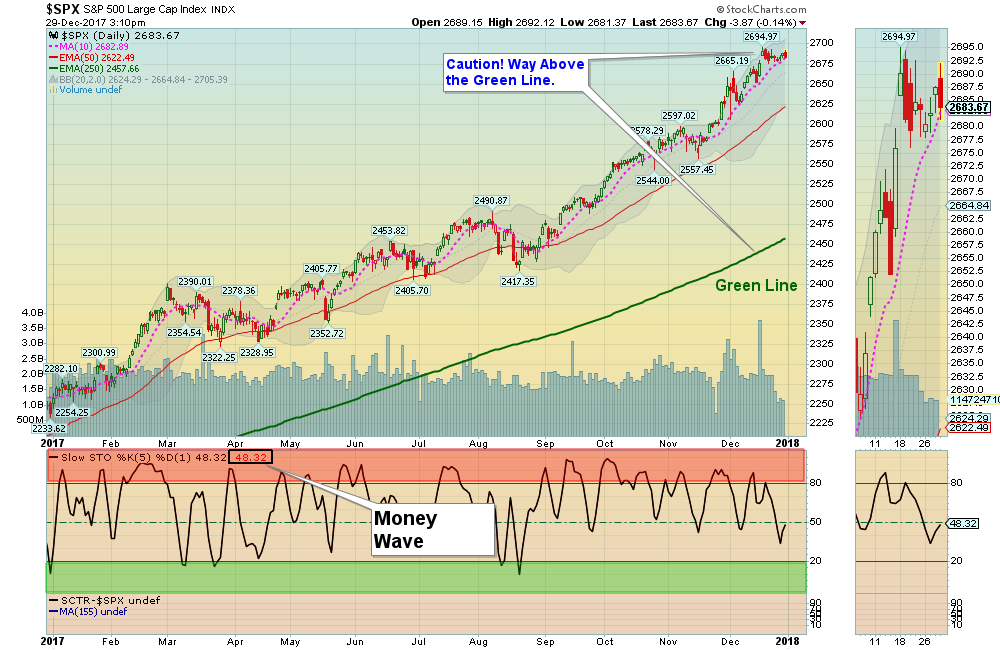
Markets were up every day this week making New Highs. No Sellers, just a Buying Stampede as the news is all Good! The S&P 500 has Support at the Pink Line of 2696 (10-day avg.).
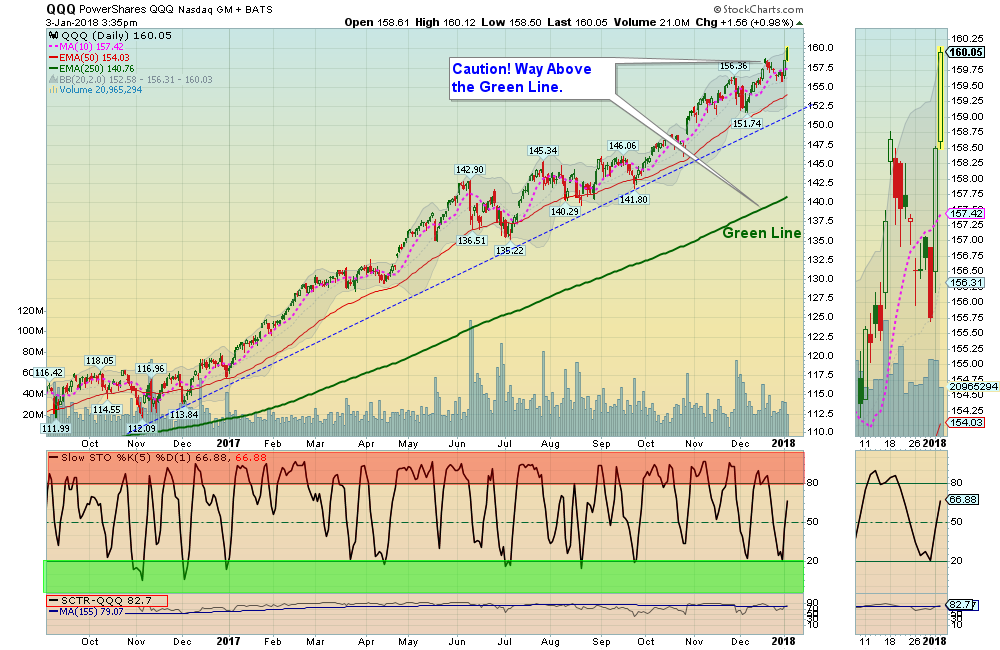
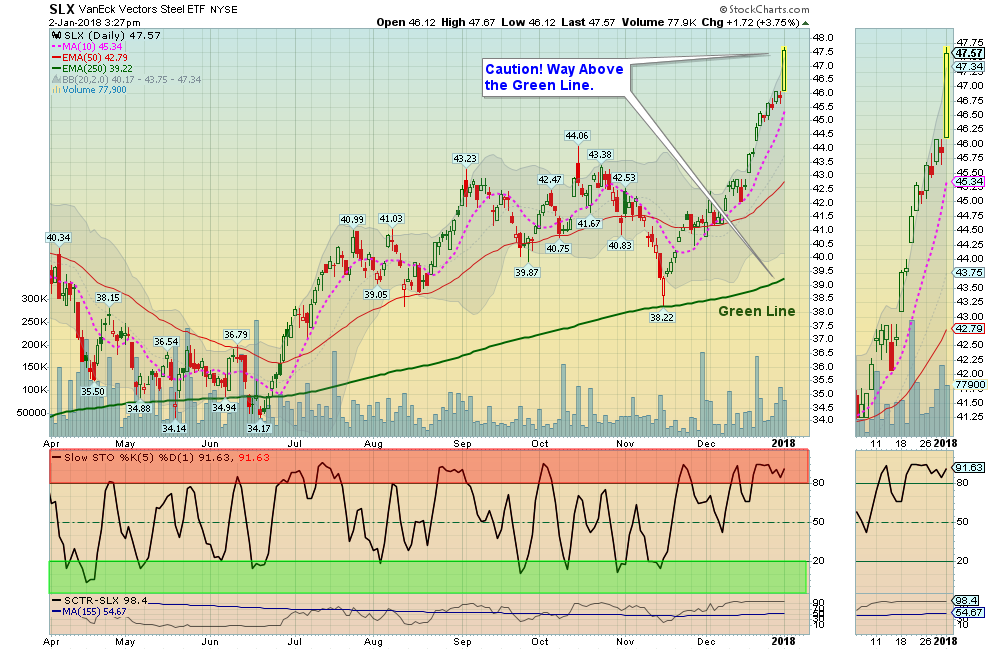
Most Leading Funds are up near the Red Zones. Please wait for the Money Wave Indicators to return to the Green Zones.
When the Markets pull-back, try to Buy Investments that recently made new Highs.
Crude Oil is down today at $61.50.
_____________________________________________________________________________________
Money Wave Buys soon!
The Following Investments will probably have a Money Wave Buy Signal
(Slow Stochastic Closing > 20) on today’s Close.
BUYS TODAY NONE TODAY
Money Wave Buys soon for:
AMPE AMPIO PHARM.
RIOT RIOT BLOCKCHAIN
Please be patient and wait for Money Wave Buys soon. We will email you when they are ready. Click on Watch List.
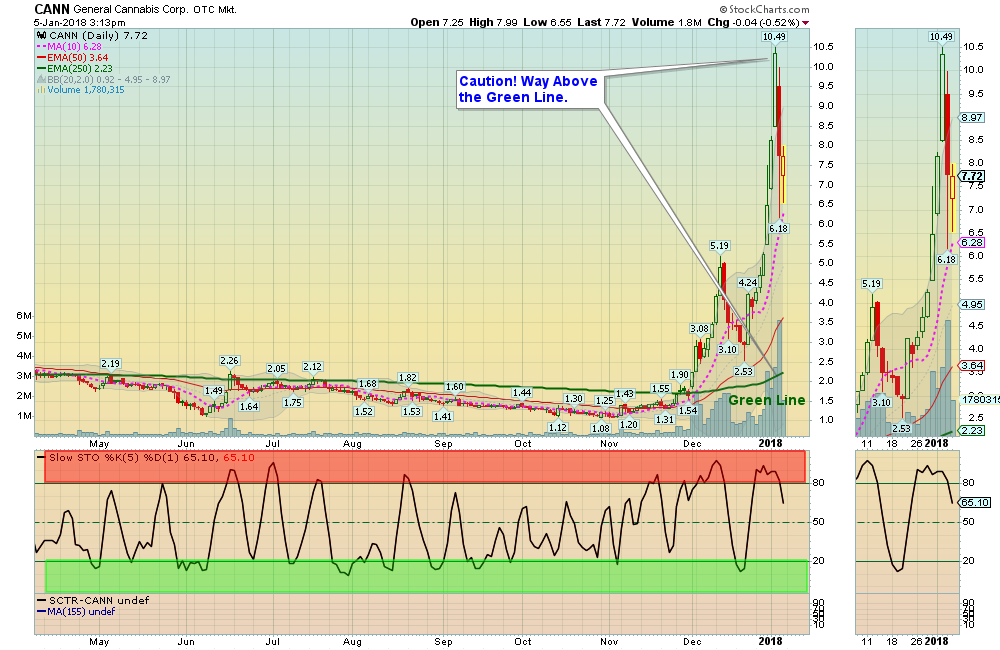
Emotions are very high now, so please do not Buy unless you are VERY NIMBLE. The Leaders are still Way Above the Green Lines (all Investments eventually return to their Green Lines).
______________________________________________________________________________________
SELLS TODAY NONE TODAY
Please Check PORTFOLIO (Open Positions) and adjust your Sell Stops.
Click for CLOSED POSITIONS.
Many like to Buy the day before, near the Close, if the Money Wave is going to create a Buy Signal (Closing > 20).
Don’t Buy if the Investment has already popped up too much. Money Wave Buys are usually good for a 3-6 % move in a few days. We will “Not Log” trades if the Reward/Risk is not at least 2:1.
HAVE A NICE WEEKEND!