SWING TRADING (SHORT TERM)
Watchlist and Charts
Watch List Watch List Charts
Current Positions Current Charts
Closed Results Trading Dashboard
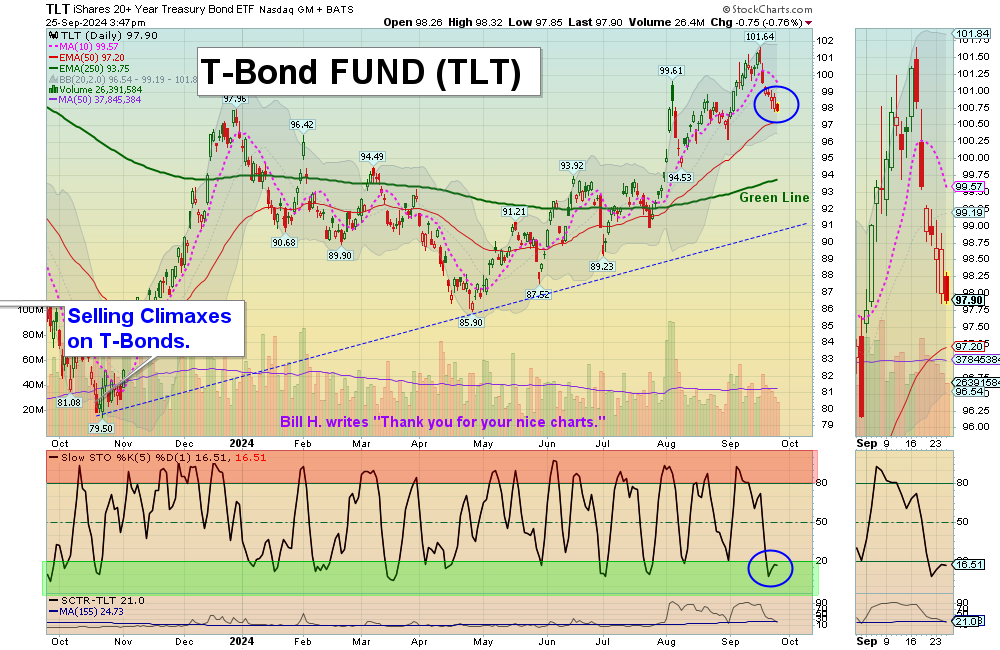
9/26/2024 The Markets Gapped Up this morning on Good News from the Semiconductors, but then jerked down at lunch time. Stocks ended up higher but Bonds continued to be weak on recent FED cutting news (Inflation Fears). Bonds ate now back down in the Green Zone (probably too late to Sell for the short term).
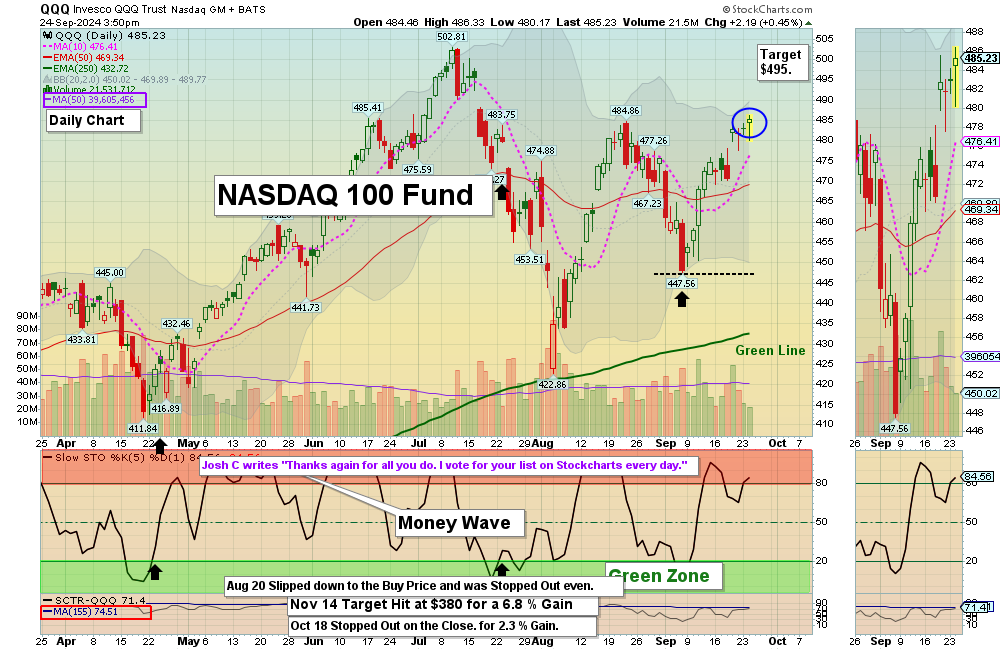
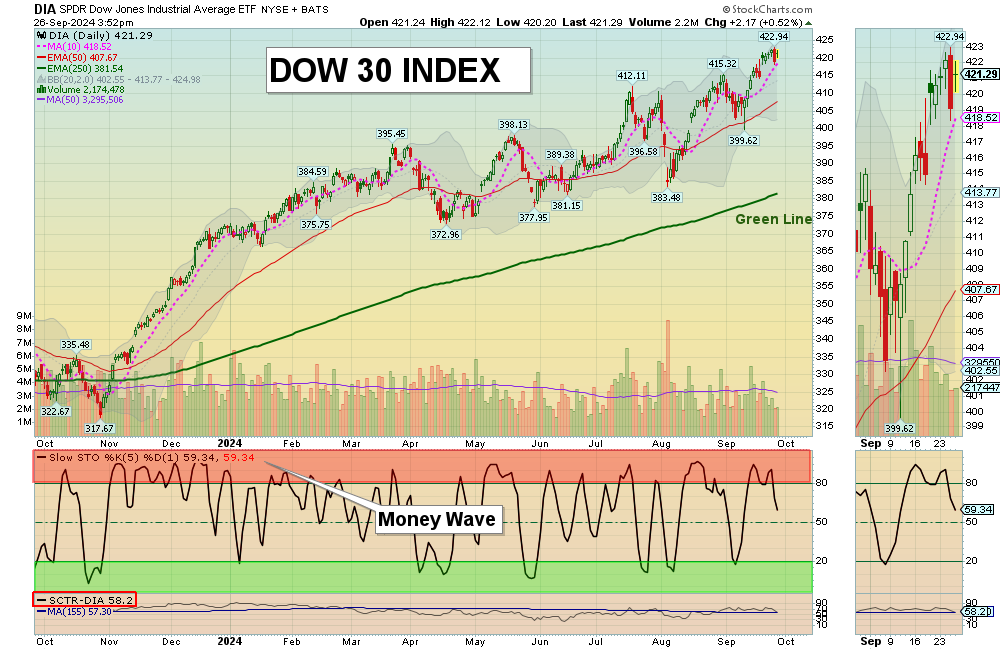
The Indices are trying to go higher than last week. So far the Buying Volume is weak. The S&P 500 Index gapped up on the opening today but could not rally much.
Wait for more Buy Signals coming up out of the Green Zones. CHARTS The best moves happen when the S&P 500 Index is also coming up out of the Green Zone.
______________________________________________________________________________
BUYS TODAY 9/26/2024
CNK CINEMARK HOLDINGS Money Wave Buy Signal today, the Volume is not high (2 Star trade).
EVGO EVGO INC. Money Wave Buy Signal today, the Volume is not high (2 Star trade).
RDFN REDFIN CORP. Money Wave Buy Signal today, but RDFN is already up 6 % (2 Star trade).
BUYS TOMORROW
ASTS AST SPACEMOBILE Wait for Daily Money Wave Close > 20 with High Volume. (2nd Buy soon).
CHWY CHEWY’S INC. Wait for Daily Money Wave Close > 20 with High Volume.
RUN SUNRUN INC. Wait for Daily Money Wave Close > 20 with High Volume.
Shop for a better price earlier in the day with Triple Buy Signal, on the same day that a Daily Money Wave Buy Signal will occur.
BUYS SOON
ABUS ARBUTUS BIOPHARMA Wait for Daily Money Wave Close > 20 with High Volume.
Please be patient and Wait for Money Wave Buy Signals. We will email you when they are ready. Follow on the WATCH LIST.
Many like to Buy the Swing Trades just before the Close, if the Money Wave is going to create a Buy Signal (Closing > 20 and up out of the Green Zone). Don’t Buy if the Security has already popped up too much. Money Wave Buy Signals are usually good for a 3-6 % move in a few days.
SELLS TODAY
ERJ EMBRAUR AIRCRAFT The Target was Hit at $37 for a 3.8 % Gain.
SG SWEETGREEN INC. EXIT if it is going to Close below the Pink Line around $35.29. The Target was already Hit at $36 for a 25.6 % Gain.
_______________________________________________________________________
DAY TRADING SETUPS. Today 5 trades for $710 at our Trading Room. Day Trading Alerts are now being sent out on our Discord Site with Live Chatting. Please install Discord app on your PC or cell for mobile notifications.
Or look for Triple Buy Pops (3 Green Circles). Big Movers today: CLSK +9%, IREN +7%, SOXL +12%.
NEW! BANANA HUNT TRADING CHARTS.
Bonds were down today and are Above the Green Line.
Crude Oil was down $2.18 today at $67.53.
MY TRADING DASHBOARD
SWING TRADING CURRENT POSITIONS
DAY TRADING SETUPS
TRADE ALERTS
STAGE CHART INVESTING
GREEN LINE CHARTS AT STOCKCHARTS
ARE YOUR INVESTMENTS ABOVE THE GREEN LINE?
GREEN LINE RULES
ETF SECTOR ROTATION SYSTEM
New TOP 100 LIST Updated Sep 1, 2024
Important Links
Top 100 Stage Chart Investing CNN Fear & Greed Index
Dividend Growth Portfolio ETF Sector Portfolio Dogs of the Dow
Long Term Strategy Stage Chart Investing Articles
* Safer Trades that meet ALL three criteria will be classified as 3 STAR, while trades that only meet two of the three criteria will be flagged as 2 STAR (more risk).
Related Post
– EVGO