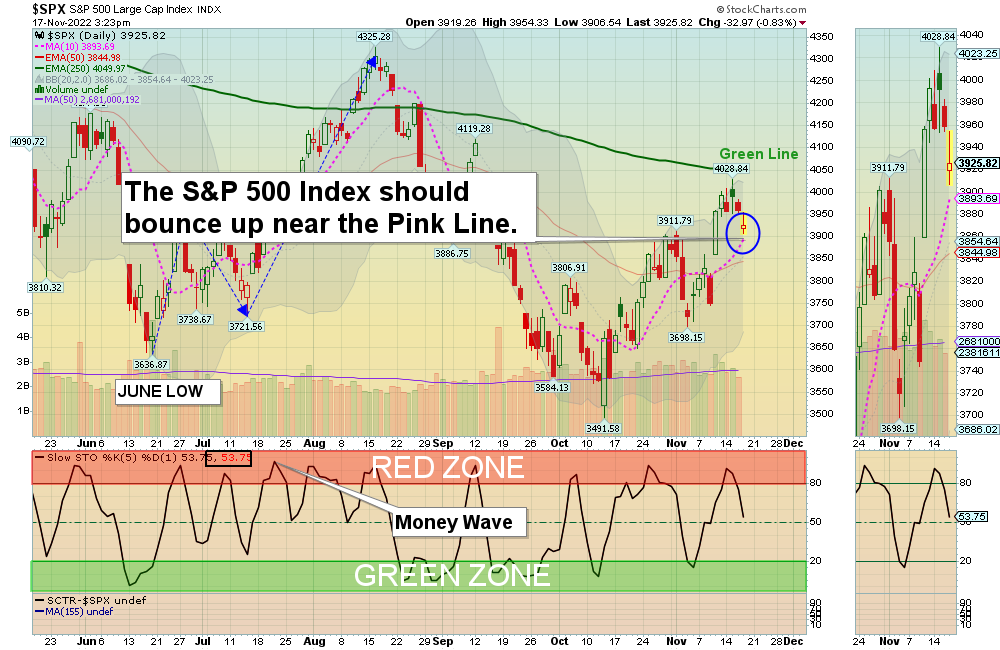
Markets were lower again today as the Indices are returning back down to the Pink Lines (10-day avgs.) Then they should bounce up again soon and try to Close Above the Green Lines, like the DOW 30 Index has done.
The Stock Indices were extended from returning back up near the Green Lines. The weak hand investors were flushed out on FEAR Selling last month. Be careful buying now as the DOW 30 Index has just bounced up 5000 points in a month.
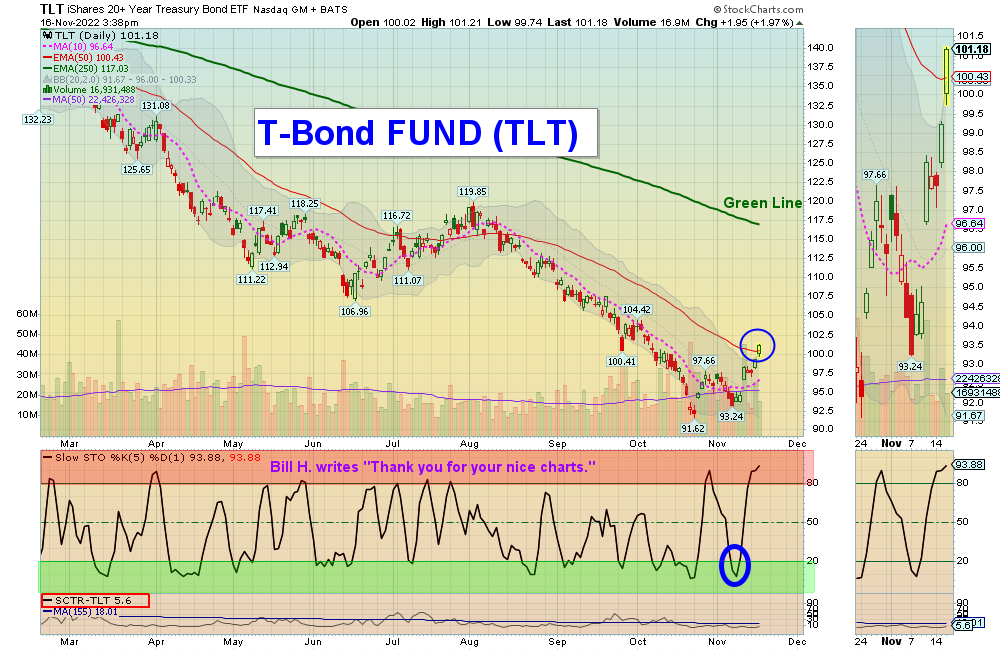
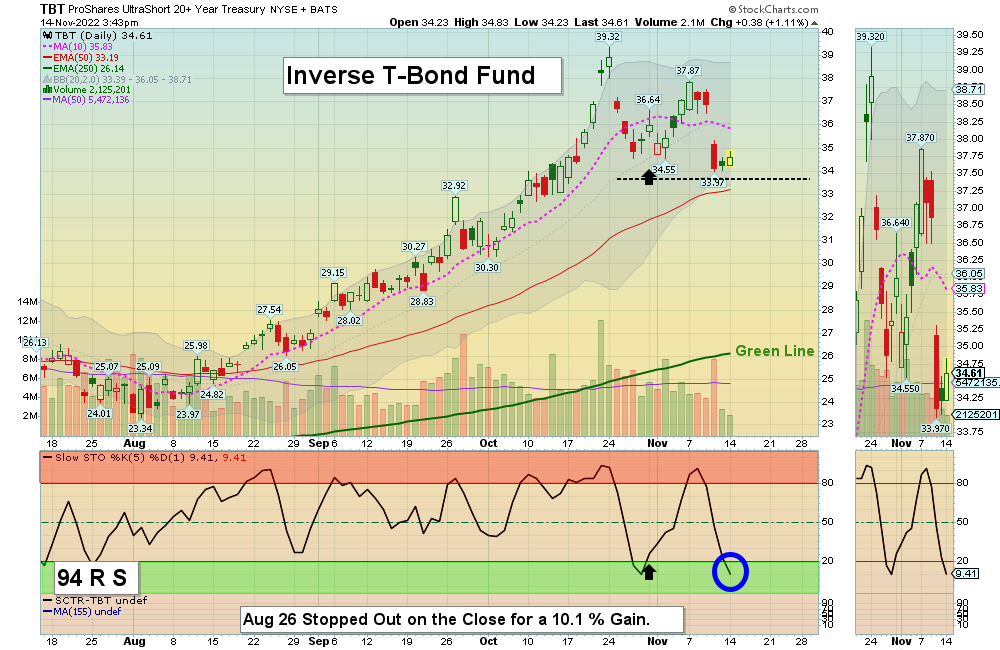
Bonds are back up to the 50-day average, which should be short term Resistance. The US Dollar and long term Interest Rates have been correcting back down towards the Green Lines causing Stocks to rally. The Inverse NASDAQ 100 and Inverse T-Bond Funds are back down in the Green Zones for Buy Signals soon. Maybe RAISE some Cash on your Stocks.
Please be patient and wait for Buy Signals for that are still Above the Green Lines. BUYS SOON – CHARTS The best moves are when the S&P 500 Index is also coming up out of the Green Zone.
_________________________________________________________________________________________________________________
BUYS TODAY 11/17/2022
PSQ INVERSE NASDAQ 100 FUND Moved above $13.84 today, but the Volume was not High. PSQ will not be Bought or Logged.
We will “Not Log” trades if the Reward/Risk is not at least 2:1, or Low Volume. These have more risk.
BUYS TOMORROW
ISEE IVERIC BIO INC. Wait for Money Wave Close > 20 with High Volume.
RJF RAYMOND JAMES FINANCIAL Money Wave must Close in the Green Zone.
Shop for a better price earlier in the day with Triple Buy Signal, on the same day that a Daily Money Wave Buy Signal will occur.
BUYS SOON
TBT INVERSE T-BOND FUND Wait for Money Wave Close > 20 with High Volume.
YANG INVERSE CHINA FUND (Leveraged 3 X High Risk) Wait for Money Wave Close > 20 with High Volume.
Please be patient and Wait for Money Wave Buy Signals. We will email you when they are ready. Follow on the WATCH LIST.
SELLS TODAY
CPRX CATALYST PHARMA EXIT if it is going to Close below the Pink Line around $15.09. The Target was already Hit at $15.50 for a 10.9 % Gain.
YPF YPF SOCIEDAD Slipped below the Buy Price of $7.65 yesterday and was Stopped Out even. (Don’t Take a Loss!)
____________________________________________________________________________________________________
DAY TRADING SETUPS. A few Triple Buy Pops today: LABD (+7%) TZA (+5%) YANG (+6%) & SOXS (+6%). ( Try out the New Side by Side layout.
DAY TRADING FOR INDICES & LARGE CAPS CHARTS.
Bonds were down today and are Way Below the Green Line.
Crude Oil was down $3.85 today at $81.74.
MY TRADING DASHBOARD
SWING TRADING CURRENT POSITIONS
DAY TRADING SETUPS
TRADE ALERTS
GREEN LINE CHARTS AT STOCKCHARTS
ARE YOUR INVESTMENTS ABOVE THE GREEN LINE?
GREEN LINE RULES
ETF SECTOR ROTATION SYSTEM
New TOP 100 LIST Updated Nov 1, 2022
Many like to Buy the Swing Trades just before the Close, if the Money Wave is going to create a Buy Signal (Closing > 20 and up out of the Green Zone). Don’t Buy if the Security has already popped up too much. Money Wave Buy Signals are usually good for a 3-6 % move in a few days.
We will “Not Log” trades if the Reward/Risk is not at least 2:1, or Low Volume. These have more risk.
Related Post
– PSQ