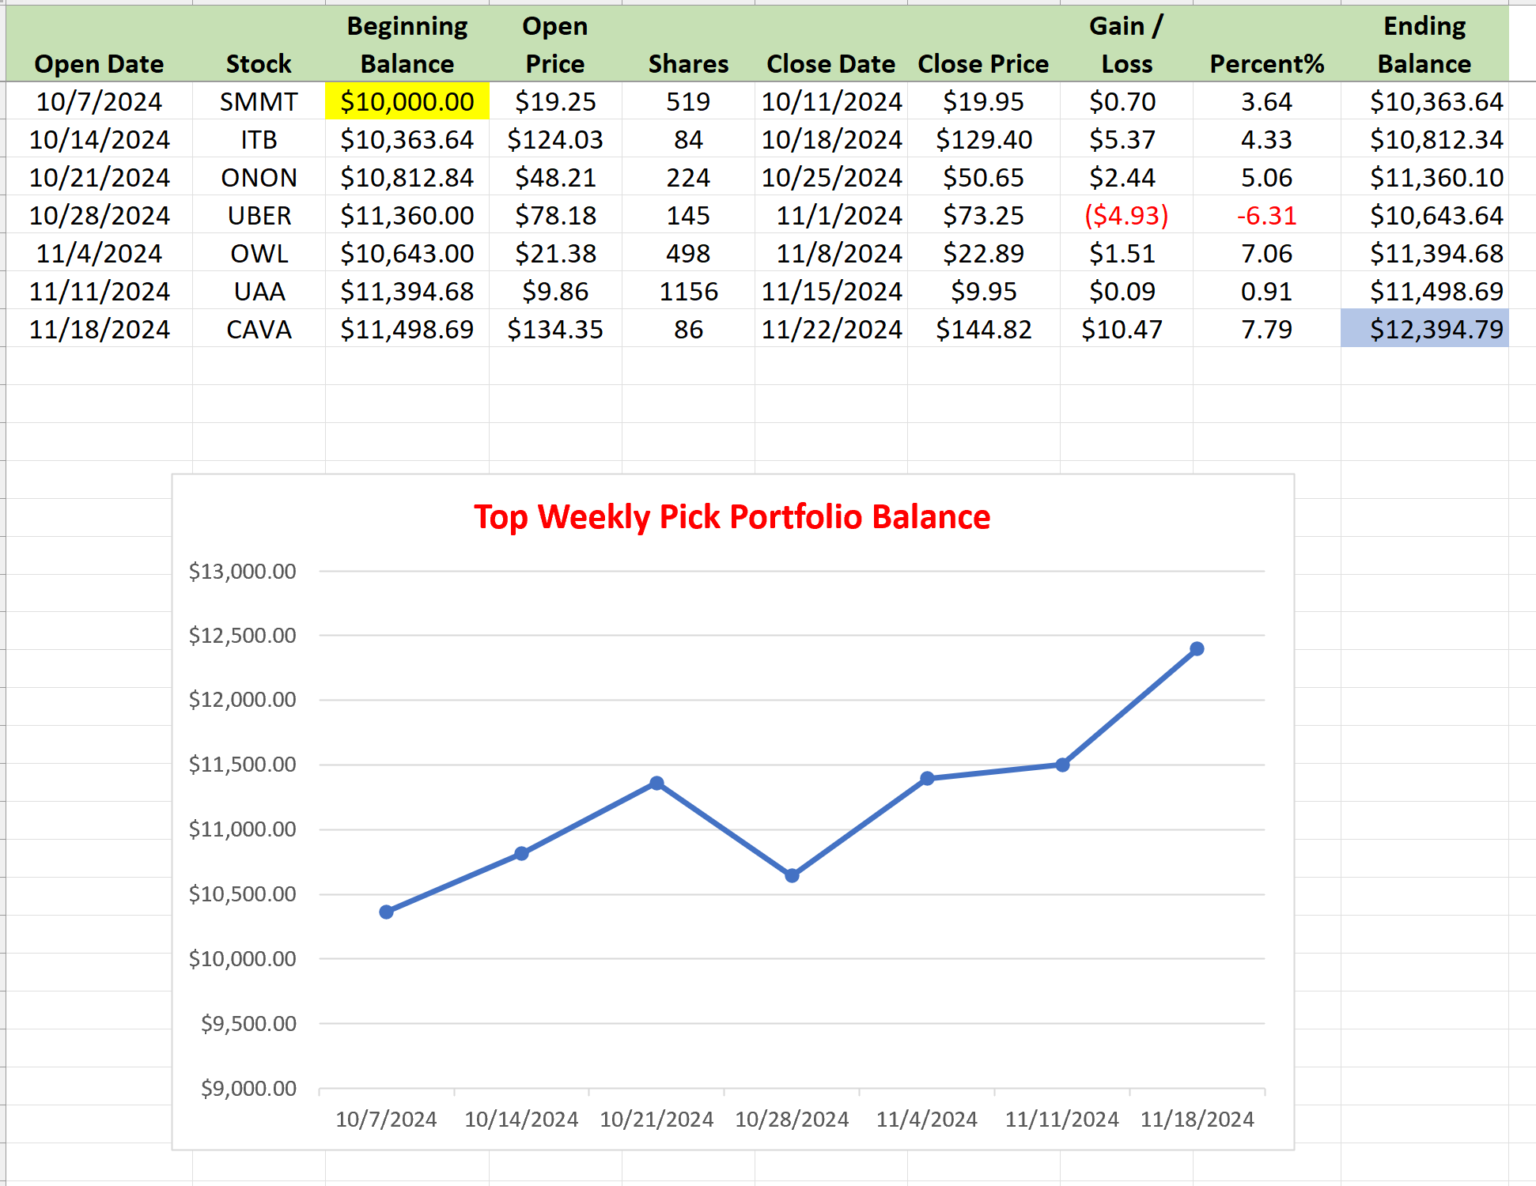
For busy investors that don’t have time to Swing Trade, we now have a simple Strategy: Top Pick of the Week. You Buy the “Pick” on Monday morning, and then Sell on Friday’s Close.
This week: DOCS DOXIMITY INC. to retest the recent high again.
This “Pick” will be emailed to you on Sunday, and we will track the performance weekly. If the stock exceeds the 15% target before Friday, it will be sold immediately to lock in profits. Otherwise, the stock is sold at Friday’s market close, regardless of the outcome (more details here).
During the week you can see the current Weekly Stock Pick Chart and Stock Pick.
______________________________________________________________________________
SWING TRADING (SHORT TERM)Watchlist and Charts
| Watch List | Watch List Charts |
| Current Positions | Current Charts |
| Closed Results | Trading Dashboard |
Current Pick and Chart
| Top Pick of the Week | Featured Stock Chart |
11/24/2024 Markets were higher for the week as the Indices are retesting the recent highs from the Election results. Now the Indices must make higher highs soon for the Rally to continue. Markets are currently very over-bought from FOMO and panic Buying (Way Above the Green Lines).
Bonds are now very over-sold from FED Printing and could bounce soon, which could help Stocks.
Bit-Coin is very over-bought and should be having a Buying Climax soon.
We Buy the strongest Leaders that make new highs, on pull-backs. So follow the Green Line System and you should continue to win more than you lose. SEE WATCH LIST
With the Green Line System, your Money should flow into the Strongest areas and your Account value should be able to grow in both Bull and Bear Markets. Follow the MONEY, not the MEDIA.
______________________________________________________________________________
For the week the Dow was up 1.99%, the S&P 500 was up 1.67% and the NASDAQ 100 was up 1.86%. The major Indices still have a Relative Strength below 80, so you should currently own the stronger Funds here.
The Inflation Index (CRB) was up 3.64% the week and is Above the Green Line, indicating Economic Expansion.
Bonds were up 0.34% for the week, and are Below the Green Line, indicating Economic Expansion.
The US DOLLAR was up 0.84% for the week, a new high.
Crude Oil was up 6.46% for the week at $71.24 and GOLD was up 5.53% at $2712.20.
_______________________________________________________________________
DAY TRADERS: We are doing many profitable Day Trades on our Discord Trading Hub (free). Please join Discord or X (Twitter) with your cell phone app for the fastest Trade Alerts and Daily email notifications during the day. Other methods of notification have been too slow. Also, please check our our Live Trading Room on YouTube during Market hours.
_______________________________________________________________________
SWING TRADE BUYS SOON:
We are now in 4 Three Star logged Swing Trading Positions for the Short & Medium Term. There are only 2 investments on the Short Term Watch List.
Be patient and WAIT for Green Zone Buy Signals!
Completed Swing Trades thru Oct. 2024: 241 Trades, + 958% Total. Avg. Trade = 3.98 % Gain (before taxes and commissions).
______________________________________________________________________________
LONG TERM WATCH LIST
ATGL Long Term Weekly Watchlist- Click here for scrolling charts.
CEG CONSTELLATION ENERGY Bought on Friday, Target $275.
Completed Long Term Trades thru Oct. 2024: 41 Trades, +249.37% Total, or 6.08% / Trade.
______________________________________________________________________________
Important Links| Top 100 | Stage Chart Investing | CNN Fear & Greed Index |
| Dividend Growth Portfolio | ETF Sector Portfolio | Dogs of the Dow |
| Long Term Strategy | Stage Chart Investing | Articles |
Alert! Market Risk is Medium (YELLOW). The probability of successful Short Term Trades is better, when the % of stocks above the 50-day avg. is below 20.
Tell your Friends about the Green Line, and Help Animals.
______________________________________________________________________________
QUESTION: John H. writes “Morning ATGL, Do you like one particular time frame for making entries and exits during the day, after you have already made the decision to trade?”
ANSWER: Hi John, and thank you for writing. For logging of trades we only use the Closing Price on the day the Money Wave Closes > 20. Many will go to the 60-min chart, and Buy in advance of the Close, but only if the Daily Money Wave is going to Close >20.
Wait for the 60-min Chart to at least cross above the Pink Line, and preferably a Triple Buy on 60-min (1. Above Pink Line 2. Above 20 on Money Wave 3. MACD Buy).
You might sell when the Investment does not bounce well off the Pink Line (10-day avg.) or Closes below Pink.
Good trading, and tell your friends!


