By ATGL
Updated April 20, 2025
[ez-toc]
Introduction
In the world of technical analysis, few indicators offer as much versatility and depth as the Ichimoku Cloud. Originally developed by Japanese journalist Goichi Hosoda in the late 1930s, the Ichimoku Kinko Hyo—meaning “one glance equilibrium chart”—provides traders with a complete view of market conditions at a single glance. This powerful tool helps identify trends, gauge momentum, and pinpoint support and resistance zones with remarkable clarity.
In this guide, we will break down the components of the Ichimoku Cloud, explain how to interpret it, and explore how to apply it to your trading strategy with confidence.
What Is the Ichimoku Cloud?
The Ichimoku Cloud is a comprehensive indicator designed to provide multiple insights simultaneously. Unlike many other indicators that serve one specific purpose, the Ichimoku Cloud delivers a broader perspective on price action, capturing both current and future potential trends.
Its key strength lies in its ability to illustrate dynamic support and resistance levels, identify trend direction, and deliver timely trading signals—all from a single visual framework. It’s especially popular in Forex, equities, and crypto trading due to its adaptability across timeframes.
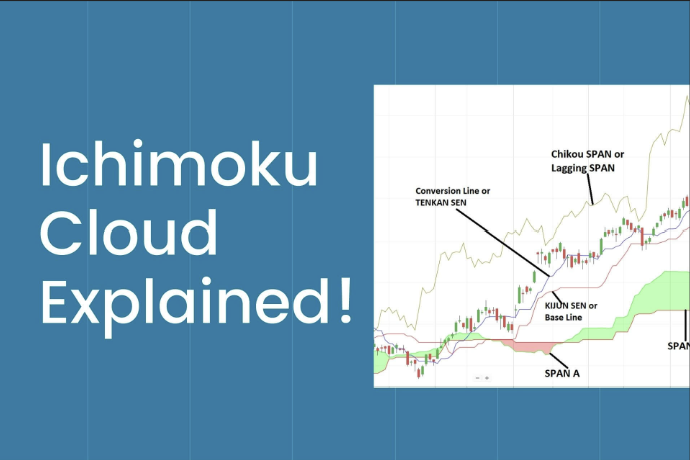
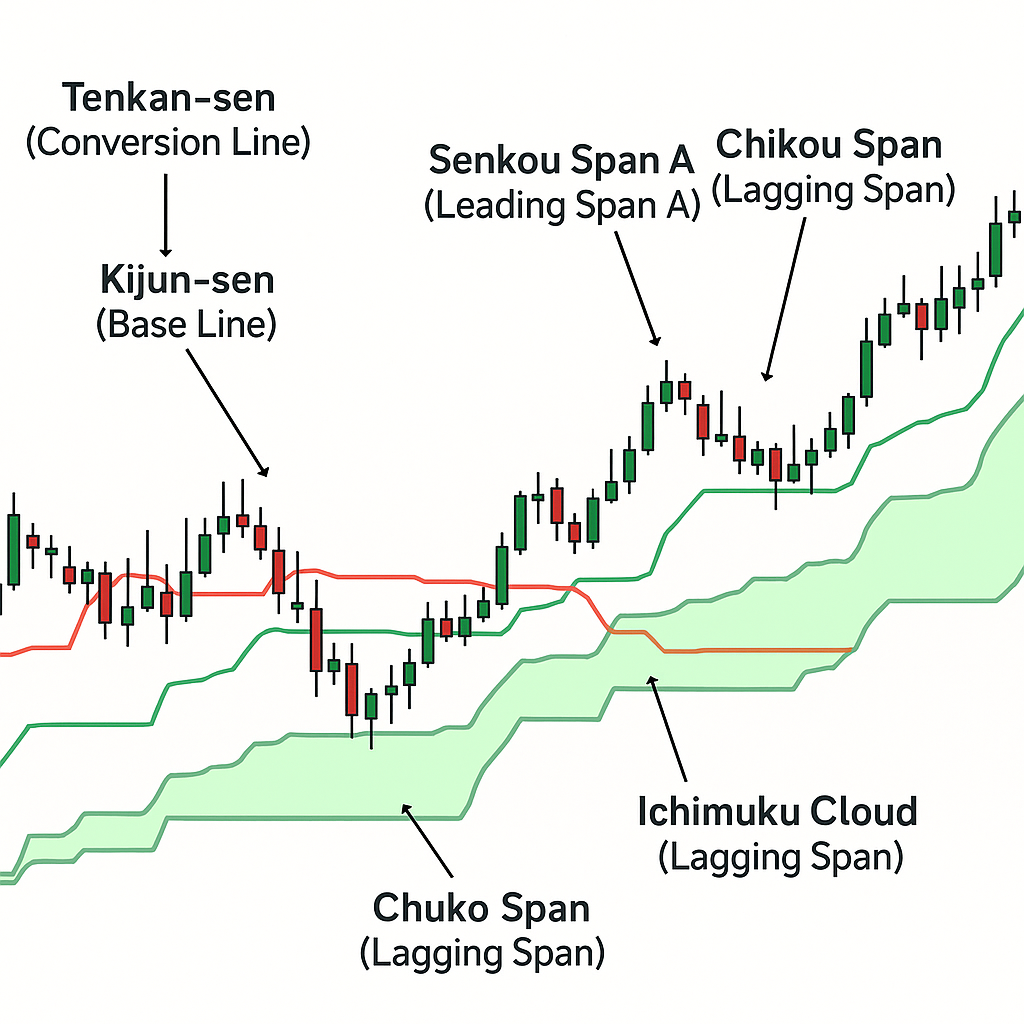
Components of the Ichimoku Cloud
The Ichimoku Cloud is made up of five key components, each serving a unique purpose. When used together, these lines form a complete visual system that shows trend direction, momentum, and support/resistance at a glance.
-
Tenkan-sen (Conversion Line)
- Formula: (9-period high + 9-period low) ÷ 2
- Purpose: This is the short-term trend indicator.
- Interpretation: The Tenkan-sen reacts quickly to price movement and can be seen as a fast-moving average. When it crosses above the Kijun-sen, it signals potential bullish momentum; when it crosses below, it may signal bearish momentum.
- Use in Strategy: Acts as a signal line for entries and a guide for short-term support/resistance.
-
Kijun-sen (Base Line)
- Formula: (26-period high + 26-period low) ÷ 2
- Purpose: Reflects the medium-term trend.
- Interpretation: The Kijun-sen is slower than the Tenkan-sen and acts like a trailing indicator. A rising Kijun-sen suggests an uptrend; a falling Kijun-sen suggests a downtrend.
- Use in Strategy: Often used as a confirmation line or trailing stop level.
-
Senkou Span A (Leading Span A)
- Formula: (Tenkan-sen + Kijun-sen) ÷ 2 (plotted 26 periods ahead)
- Purpose: Forms one boundary of the Ichimoku Cloud.
- Interpretation: Span A reacts more quickly than Span B and shifts with changes in short-to-mid-term momentum.
- Use in Strategy: When Span A is above Span B, it creates a green “Kumo” (cloud) indicating bullish momentum.
-
Senkou Span B (Leading Span B)
- Formula: (52-period high + 52-period low) ÷ 2 (plotted 26 periods ahead)
- Purpose: Forms the second boundary of the cloud.
- Interpretation: Span B reacts more slowly due to a longer lookback period, creating a more stable support/resistance zone.
- Use in Strategy: When Span B is above Span A, the cloud turns red, indicating bearish sentiment.
-
Chikou Span (Lagging Span)
- Formula: Current closing price plotted 26 periods behind
- Purpose: Offers confirmation of current trend momentum.
- Interpretation: If the Chikou Span is above past price levels, the trend is likely bullish; if below, bearish.
- Use in Strategy: Acts as a secondary confirmation signal—traders often wait for the Chikou Span to confirm a breakout or trend continuation.
How These Components Work Together
The brilliance of the Ichimoku system is that each component reinforces the others:
- The cloud (Kumo) itself acts as dynamic support/resistance.
- The Tenkan/Kijun crossover provides early entry signals.
- The Chikou Span confirms whether price action aligns with the trend.
This synergy allows traders to quickly determine whether to stay in a trade, take profit, or avoid entering altogether. Once you become familiar with interpreting all five components simultaneously, you’ll have a comprehensive, visual edge in the market.
Refer to the illustration above to see how each component of the Ichimoku Cloud is plotted and interacts with price action in a real chart example.
How to Read the Ichimoku Cloud
Reading the Ichimoku Cloud involves analyzing the relationship between price action and the five key components of the system. Unlike traditional indicators, which often provide a single data point, the Ichimoku system gives a layered view of trend direction, momentum, and potential support/resistance areas—all in one glance.
The central feature of the system is the Kumo, or cloud, formed by Senkou Span A and Senkou Span B. This shaded region acts as a dynamic area of support and resistance. The cloud’s location relative to the current price provides critical trend insight:
- Price above the cloud = Bullish trend
- Price below the cloud = Bearish trend
- Price inside the cloud = Consolidation or indecision
The thickness of the cloud also matters. A thicker cloud suggests stronger resistance or support, making it harder for price to break through. A thin cloud may indicate weakening momentum and a potential reversal.
Another important signal comes from the interaction between the Tenkan-sen (Conversion Line) and Kijun-sen (Base Line). When the Tenkan-sen crosses above the Kijun-sen, it creates a bullish signal, especially when both are positioned above the cloud. Conversely, a bearish signal forms when the Tenkan-sen crosses below the Kijun-sen, particularly when this happens below the cloud.
The Chikou Span (Lagging Line) serves as a confirmation tool. It is plotted 26 periods behind the current price and is used to validate current trend strength:
- Chikou Span above the price = Confirms bullish conditions
- Chikou Span below the price = Confirms bearish conditions
Color changes in the cloud also reflect momentum. When Senkou Span A is above Senkou Span B, the cloud is typically green, indicating bullish momentum. When Span A falls below Span B, the cloud turns red, signaling bearish sentiment.
By learning to read the Ichimoku Cloud’s structure—where the price sits in relation to the cloud, how the lines interact, and what the Chikou Span confirms—traders can develop a multi-dimensional view of the market to guide more strategic decisions.
Key Trading Signals
The Ichimoku Cloud system generates several types of trading signals that help traders identify potential entries, exits, and trend confirmations. These signals are most powerful when multiple components align in the same direction, providing a confluence of evidence before a trade is placed.
One of the most widely used signals is the Tenkan-sen and Kijun-sen crossover, which functions similarly to a moving average crossover. When the Tenkan-sen (Conversion Line) crosses above the Kijun-sen (Base Line), it generates a bullish signal, suggesting the start or continuation of upward momentum. Conversely, when the Tenkan-sen crosses below the Kijun-sen, it signals a potential bearish reversal or downward momentum. These crossovers are more reliable when they occur in favorable trend conditions—for example, above the cloud in an uptrend or below the cloud in a downtrend.
The Kumo Breakout, or cloud breakout, is another critical signal. When the price breaks above the cloud, it often indicates the beginning of a bullish trend. A break below the cloud typically suggests bearish conditions. Traders often wait for confirmation from other elements, such as the Chikou Span or a bullish crossover, before acting on a breakout alone.
A more subtle but meaningful signal is the Kumo Twist, which occurs when Senkou Span A crosses over Senkou Span B in the future projection. A bullish twist (Span A moves above Span B) turns the cloud green and can hint at upcoming bullish momentum, while a bearish twist (Span A falls below Span B) turns the cloud red and may suggest weakening market strength.
The Chikou Span (Lagging Line) serves as a critical confirmation signal. Traders look at whether the Chikou Span is positioned above or below past price action. A Chikou Span above price confirms bullish signals and reinforces the potential strength of an uptrend, while a Chikou Span below price confirms bearish sentiment.
To summarize the key signals:
- Bullish and Bearish Crosses: Tenkan-sen crosses above or below Kijun-sen.
- Kumo Breakouts: Price breaks through the cloud from below (bullish) or above (bearish).
- Kumo Twists: Span A crosses Span B, signaling a potential change in trend direction.
- Lagging Span Confirmation: Chikou Span supports the trend when aligned above (bullish) or below (bearish) the price.
These signals are most effective when they align across multiple components, helping traders filter out noise and focus on high-probability setups. By understanding and applying these signals in the right context, traders can more confidently navigate market trends and reversals.
Popular Ichimoku Cloud Trading Strategies
The Ichimoku Cloud isn’t just an indicator—it’s a complete trading system. When used correctly, it offers a structured way to build strategies for trend-following, breakouts, and even reversals. Below are some of the most popular strategies traders use to apply Ichimoku Cloud signals in real-time.
-
Trend Continuation Strategy
This is one of the most straightforward ways to trade using the Ichimoku Cloud—entering positions in the direction of the prevailing trend when price action and indicator components align. In a bullish setup, the price is positioned above the cloud, the Tenkan-sen is above the Kijun-sen, and the Chikou Span is above the price. In these conditions, traders often look for pullbacks to the Kijun-sen or even to the edge of the cloud as buying opportunities. The same logic applies in reverse for bearish setups, where traders enter short positions when the price is below the cloud, the Tenkan-sen is below the Kijun-sen, and the Chikou Span confirms the trend.
-
Cloud Breakout Strategy
Also known as the Kumo Breakout, this strategy focuses on trading breakouts when price moves through the cloud. A bullish breakout occurs when price breaks above the cloud from below, ideally confirmed by a bullish Tenkan/Kijun crossover and a supportive Chikou Span. This is seen as a potential shift from a ranging or bearish environment into a new uptrend. Conversely, a bearish breakout happens when the price breaks down through the cloud, signaling a possible trend reversal to the downside. Traders often wait for a strong candlestick close beyond the cloud and seek confirmation from other components before entering.
-
Kumo Twist and Reversal Anticipation
The Kumo Twist—when Senkou Span A crosses over Senkou Span B—offers a forward-looking signal of potential trend change. While not typically used in isolation for entries, it can be useful for anticipating reversals or trend weakening. Traders may use the Kumo Twist to re-evaluate existing positions, tighten stops, or prepare for a shift in market direction. This strategy becomes more actionable when combined with crossovers or a Chikou Span confirmation.
-
Multi-Timeframe Strategy
One of the more advanced uses of Ichimoku involves analyzing multiple timeframes to ensure alignment. For example, a trader may use the daily chart to confirm a bullish trend and then drop down to a 4-hour chart to find precise entry points—such as a Tenkan/Kijun crossover or pullback near the cloud. This method reduces the risk of false signals and improves timing by allowing traders to trade in the direction of the dominant trend while entering at optimal levels on a shorter timeframe.
-
Combining with Other Indicators
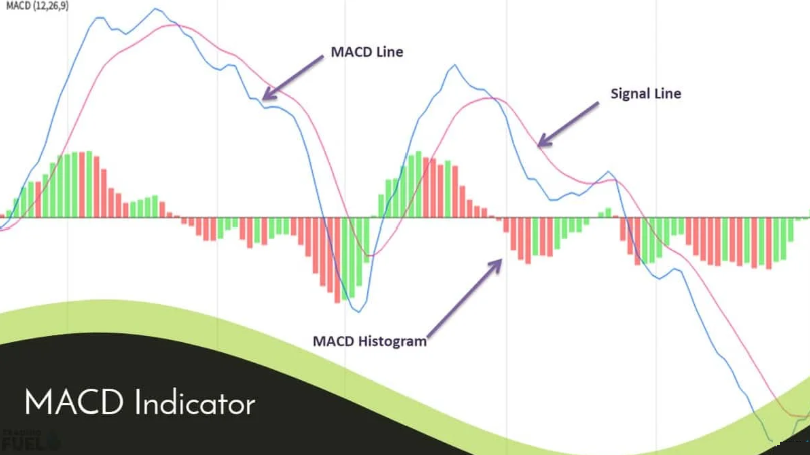
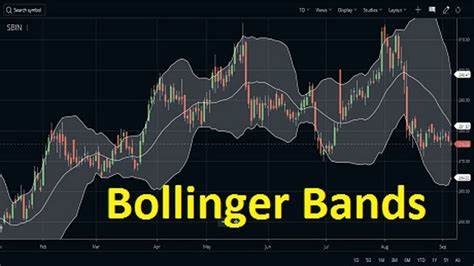
While Ichimoku is powerful on its own, many traders enhance their strategies by pairing it with other tools like volume, RSI, or MACD. For instance, an Ichimoku breakout paired with an RSI above 50 or a MACD bullish crossover may offer added confirmation. Volume spikes during a Kumo breakout can also validate the strength of the move. These combinations are especially useful in volatile markets where extra confirmation helps filter out noise.
These strategies demonstrate the versatility of the Ichimoku Cloud. Whether you’re looking to catch trend continuations, capitalize on breakouts, or anticipate reversals, the system offers a rich set of tools for disciplined, rules-based trading.
Pros and Cons of Using Ichimoku Cloud
The Ichimoku Cloud is one of the most comprehensive technical indicators available, offering a full view of market structure, trend, momentum, and support/resistance in a single system. However, like any tool, it comes with both advantages and limitations. Understanding these can help traders determine if the Ichimoku Cloud aligns with their trading style and goals.
Pros
One of the greatest strengths of the Ichimoku Cloud is its all-in-one functionality. Instead of using separate indicators for trend direction, momentum, and support/resistance, Ichimoku integrates these elements into a cohesive visual system. This reduces chart clutter while providing layered confirmation for trading decisions.
The indicator excels in trend-following environments, where it can help traders stay in winning trades longer and avoid early exits. The visual nature of the cloud allows traders to easily identify trend direction and strength at a glance. Additionally, features like the Kumo (cloud) provide dynamic support and resistance levels that adapt to market conditions, rather than relying on static price levels.
Another key advantage is the forward-looking nature of the indicator. With components like the Senkou Span A and B plotted 26 periods ahead, Ichimoku offers insights into future areas of support and resistance, giving traders a strategic edge in planning entries and exits.
Cons
Despite its versatility, the Ichimoku Cloud can be intimidating to beginners due to its multiple components and somewhat complex visual layout. For those unfamiliar with its structure, interpreting the lines and signals may initially feel overwhelming.
Another drawback is that the system may be less effective in sideways or choppy markets. In such conditions, the indicator can produce false signals or conflicting information, particularly when price action moves erratically in and out of the cloud. Traders using Ichimoku in non-trending markets may need to rely on additional filters or avoid trading altogether during these phases.
Additionally, due to the way the Ichimoku lines are calculated—based on historical highs and lows—it tends to work best on longer timeframes, such as 1-hour, 4-hour, or daily charts. Traders using shorter timeframes or high-frequency strategies may find that the signals lag or require confirmation from faster-reacting tools.
While not without limitations, the Ichimoku Cloud offers a powerful blend of trend, momentum, and support/resistance analysis for traders who take the time to understand its structure and apply it within the right market context.
Best Timeframes and Markets for Ichimoku
The Ichimoku Cloud is most effective on higher timeframes, where market noise is reduced, and trend signals are more reliable. Traders commonly use the indicator on 1-hour, 4-hour, and daily charts, as these provide a balanced view of short- and medium-term trends. On lower timeframes—such as 5-minute or 15-minute charts—the signals can become less dependable due to frequent fluctuations and false breakouts. In terms of markets, Ichimoku is particularly well-suited for Forex, cryptocurrencies, and equity indices, where trends tend to develop with sufficient momentum and duration. It also performs well in commodities and large-cap stocks, provided there is ample liquidity and price structure. For optimal results, traders should apply Ichimoku in trending environments and avoid using it during periods of low volatility or sideways movement, where its predictive power is diminished.
Tips for Beginners
If you’re new to the Ichimoku Cloud, these practical tips can help you ease into using the indicator more effectively:
- Start with the basics: Focus on just the Tenkan-sen, Kijun-sen, and the Cloud before incorporating the full system.
- Use a demo account: Practice identifying signals and test strategies in a risk-free environment to build confidence.
- Apply it in trending markets: Ichimoku performs best in clear uptrends or downtrends—avoid using it during sideways or choppy conditions.
- Combine with other indicators: For better confirmation, pair Ichimoku with tools like RSI, MACD, or volume.
- Stick to higher timeframes: Start with 1-hour or daily charts, where signals are more reliable and less prone to noise.
- Be patient and consistent: Like any technical system, it takes time and repetition to master the patterns and nuances.
These tips will help you build a strong foundation with Ichimoku and gradually gain the confidence to integrate it into your full trading strategy.
Putting It All Together: Mastering the Ichimoku Cloud with Above the Green Line
The Ichimoku Cloud is a robust, all-in-one trading indicator that provides insight into market trends, momentum, and key price levels. Though it may seem complex at first glance, mastering it can offer a significant edge for disciplined traders. Whether you’re day trading, swing trading, or investing long-term, the Ichimoku Cloud can help clarify market direction and uncover high-probability setups.
Approach it with patience, test it with historical data, and integrate it with other tools to make it a valuable part of your trading arsenal.
For more on technical analysis, chart patterns, and indicator strategies, explore our full collection of trading guides. Join Above the Green Line today and learn more.

Related Articles
[pt_view id=”9517038dwu”]