
Watchlist and Charts
| Watch List | Watch List Charts |
| Current Positions | Current Charts |
| Closed Results | Trading Dashboard |
Current Pick and Chart
| Top Pick of the Week | Featured Stock Chart |
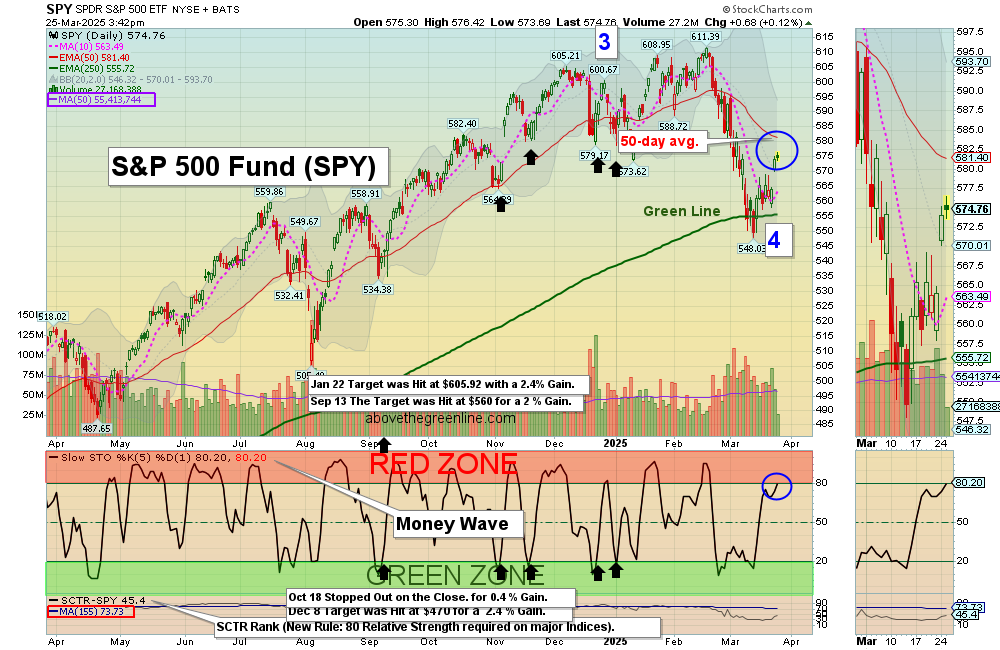
March 25, 2025, Nasdaq continued its Monday strength, moving smoothly and gently upward. SPY also had an upside movement, approaching the 60-minute Banana Line. The overall market remained positive, supporting bullish sentiment. Our current swing trades are performing well, aligning with market momentum. AI and tech sectors showed steady buying interest. As long as the trend holds, we can expect further strength ahead.
Wait for more Buy Signals coming up out of the Green Zones. CHARTS The best moves happen when the S&P 500 Index is also coming up out of the Green Zone. ______________________________________________________________________________
BUYS TODAY 3/25/2025
BUYS SOON
BABA Alibaba Group Holding Ltd. Wait for next Daily Money Wave Close > 20 with High Volume.
FXI iShares China Large-Cap ETF. Wait for next Daily Money Wave Close > 20 with High Volume.
KC KINGSOFT CLOUD Wait for next Daily Money Wave Close > 20 with High Volume.
TUYA TUYA INC. Wait for next Daily Money Wave Close > 20 with High Volume.
VNET 21 VIANET GROUP Wait for next Daily Money Wave Close > 20 with High Volume.
XPEV XPENG INC. Wait for next Daily Money Wave Close > 20 with High Volume.
Shop for a better price earlier in the day with Green Candle Buy Signal, on the same day that a Daily Money Wave Buy Signal will occur.
Many like to Buy the Swing Trades just before the Close, if the Money Wave is going to create a Buy Signal (Closing > 20 and up out of the Green Zone). Don’t Buy if the Security has already popped up too much. Money Wave Buy Signals are usually good for a 3-6 % move in a few days.
SELLS TODAY
HOOD ROBINHOOD MKTS Slipped own to the Buy Price and was Stopped Out even.
_____________________________________________________________________________
DAY TRADING SETUPS. Today we had 10 tiny scalp trades for nice Gains at our Trading Room. In this Emotional Market now, Day Trading Alerts are not being sent out on our Discord Site with Live Chatting. Please install Discord app on your PC or cell for mobile notifications. Check out our Live Stream.
Or look for Green Candle Buy Pops (Red Candle turns Green). Big Movers today: CVNA + 5% BBAI+6% LABD +7%
Bonds were up today and are Above the Green Line.
Crude Oil was down $0.01 today at $69.11.
MY TRADING DASHBOARD
SWING TRADING CURRENT POSITIONS
DAY TRADING SETUPS
TRADE ALERTS
STAGE CHART INVESTING
GREEN LINE CHARTS AT STOCKCHARTS
ARE YOUR INVESTMENTS ABOVE THE GREEN LINE?
GREEN LINE RULES
ETF SECTOR ROTATION SYSTEM
Updated TOP 100 LIST Updated Mar 1, 2024
Important Links
Top 100 Stage Chart Investing CNN Fear & Greed Index
Dividend Growth Portfolio ETF Sector Portfolio Dogs of the Dow
Long Term Strategy Stage Chart Investing Articles
* Safer Trades that meet ALL three criteria will be classified as 3 STAR, while trades that only meet two of the three criteria will be flagged as 2 STAR (more risk).
Related Post
– KC


