By ATGL
Updated February 28, 2025
[ez-toc]
The bear flag pattern is a technical continuation pattern that signals the potential for an ongoing downtrend after a brief consolidation period. It is a critical formation in bearish markets, offering you strategic entry points for short positions. When properly identified and traded, the bear flag can provide a strong risk-reward setup with defined stop-loss levels and profit targets.
Mastering the bear flag pattern will help you identify its structure, distinguish it from similar formations, and apply advanced trading strategies with greater confidence.
What Is a Bear Flag Pattern?
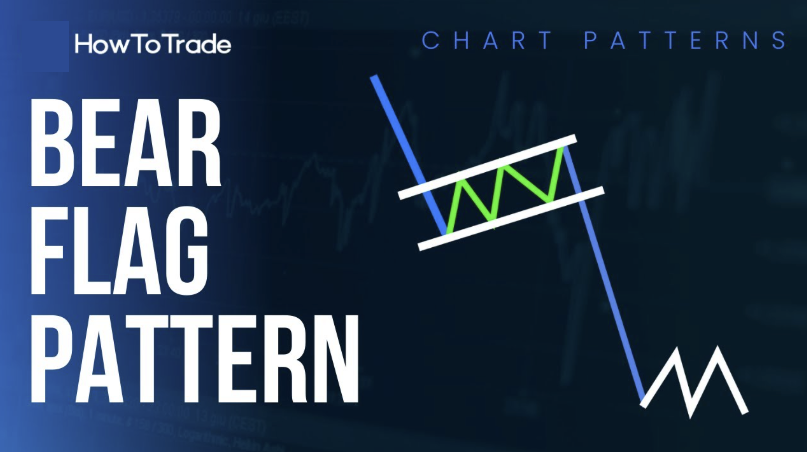
A bear flag pattern occurs when an asset experiences a sharp decline (forming the flagpole), followed by a period of consolidation where price action moves slightly upward or sideways before breaking down again. This structure reflects a temporary pause in selling pressure, allowing weaker hands to exit before institutional traders and high-frequency algorithms push prices lower.
The pattern is most reliable in strong downtrends, as traders and institutional investors look to capitalize on momentum-driven selling. It can be observed in equities, forex, commodities, and cryptocurrency markets.
Key Characteristics of a Bear Flag Pattern
To effectively trade a bear flag, it is essential to recognize its defining traits:
- Preceding Downtrend: The pattern must follow a strong and rapid decline, often fueled by negative news, fundamental weaknesses, or broad market sell-offs.
- Parallel or Slightly Upward-Sloping Channel: The consolidation phase forms a rectangular flag, with price action moving in a controlled counter-trend manner.
- Declining Volume During Consolidation: A healthy bear flag shows reduced volume during the pullback phase, indicating a lack of strong buying interest.
- Breakout Confirmation with High Volume: A decisive breakdown below the flag’s support zone, accompanied by increasing volume, confirms the pattern and signals a strong selling opportunity.
Understanding these characteristics can help you avoid misinterpreting false breakouts and suboptimal trade entries.
Anatomy of a Bear Flag Pattern
1. The Flagpole
The flagpole is the initial sharp decline in price that sets up the pattern. It often forms due to:
- A news-driven event (e.g., earnings misses, regulatory actions, macroeconomic concerns).
- A breakdown of key technical support levels, triggering stop-loss liquidations.
- Institutional sell orders increasing downward momentum.
In a bearish flag pattern, the flag pole represents a steep decline in price, driven by strong selling pressure. The steeper and longer the flagpole, the stronger the pattern — as this suggests a prevailing bearish sentiment.
2. The Flag (Consolidation Phase)
After the strong drop, a bearish consolidation phase occurs, forming a flag-like structure.
- This period of stability occurs as traders digest recent losses and reposition.
- The price action moves in a controlled, upward-sloping or horizontal manner, often forming a bearish rising wedge or parallel channel.
- Buying volume remains weak, signaling that demand is insufficient to reverse the prior downtrend.
A proper bear flag does not retrace more than 50% of the flagpole — if it does, the pattern becomes less reliable.
3. The Breakdown (Continuation of the Downtrend)
The breakout occurs when the price breaks below the lower boundary of the flag, resuming the initial bearish momentum.
- Volume spikes on the breakdown confirm institutional participation and algorithmic selling.
- A measured move projection (discussed later) can help determine potential price targets.
Traders who focus on drawing stock charts correctly can more effectively track price trends and confirm bearish continuation signals.
Significance of the Bear Flag Pattern
You can use the bear flag pattern for several reasons:
- High Probability of Trend Continuation: When a bear flag forms in a well-established downtrend, the likelihood of further downside movement is statistically high.
- Well-Defined Trade Parameters: Unlike other chart patterns that require subjective analysis, the bear flag offers clear entry, stop-loss, and profit targets.
- Works Across Multiple Timeframes: Swing traders use bear flags on daily charts, while day traders look for them on shorter timeframes (5-minute, 15-minute, 1-hour charts).
- Institutional Activity Confirmation: The declining volume in the consolidation phase suggests that large investors are not accumulating, reinforcing bearish sentiment.
A strong understanding of identifying trends in stock charts helps you differentiate between temporary pullbacks and true continuation patterns like the bear flag.
Bull Flag Pattern vs. Bear Flag: Key Differences
While both bull and bear flags share structural similarities, they signal opposite trends:
| Feature | Bear Flag Pattern | Bull Flag Pattern |
|---|---|---|
| Market Trend | Downtrend | Uptrend |
| Flagpole Direction | Sharp decline | Sharp rally |
| Consolidation Phase | Slight upward slope | Slight downward slope |
| Breakout Direction | Downward | Upward |
| Volume Confirmation | High volume on breakdown | High volume on breakout |
Recognizing these differences helps you avoid misidentifying patterns and making costly mistakes.
Trading Strategies for Bear Flag Patterns
Successfully trading the bear flag pattern requires a disciplined approach that incorporates confirmation signals, strategic entry and exit points, and effective risk management. While the pattern itself provides a roadmap for potential price movements, traders must validate each trade setup with additional technical factors to avoid false breakouts.
Waiting for Breakout Confirmations
Entering before confirmation increases the risk of false breakouts. Traders should wait for:
- A decisive break below the flag’s support.
- A volume spike confirming strong selling pressure.
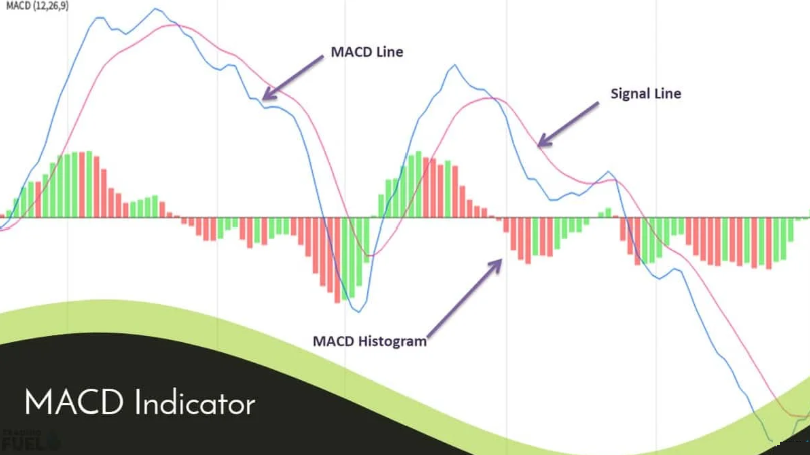
- RSI (Relative Strength Index) below 40 or a bearish MACD crossover.
Determining Entry Points
The goal is to time the entry after a confirmed breakdown to avoid false signals and ensure the trade aligns with prevailing market momentum.
- Enter on a confirmed breakdown with strong momentum.
- Use a sell stop order below the flag’s support.
- Watch for a retest of the broken support before entry.
Identifying Exit Points
You should set realistic profit targets based on the pattern’s structure and overall market conditions.
- Target a measured move by projecting the flagpole’s height downward.
- Use previous support levels for take-profit zones.
- Adjust stops based on RSI or a trailing stop strategy.
Risk Management Techniques
Proper risk controls help you keep losses manageable while allowing for high-reward opportunities.
- Place stop-loss above the consolidation range.
- Maintain a 1:2 risk-to-reward ratio.
- Limit trade risk to 1-2% of total capital.
Pros and Cons of Trading Bear Flag Patterns
Pros
- High probability setup in strong downtrends.
- Clear entry and exit points.
- Provides a structured approach for short-selling.
- Works across multiple asset classes and timeframes.
Cons
- False breakouts can lead to whipsaws.
- Requires volume confirmation for reliability.
- Less effective in choppy or sideways markets.
Effectively Utilizing the Bear Flag Pattern in Trading
The bear flag pattern is a valuable continuation setup for traders looking to capitalize on sustained downtrends. For in-depth market analysis and real-time trade alerts, consider joining Above the Green Line’s premium membership. You can also refine your technical analysis skills with our guides on trading patterns and the Bear Pennant trading pattern.

Related Articles
[pt_view id=”9517038dwu”]