By ATGL
Updated August 27, 2024
[ez-toc]
Traders rely on the stochastic oscillator in technical analysis to identify potential buy and sell signals. This momentum indicator compares an asset’s closing price to its recent price range to determine whether the asset is overbought or oversold. Understanding the calculation and interpretation of the stochastic oscillator can significantly enhance your trading strategies and decision-making.
What Is a Stochastic Oscillator?
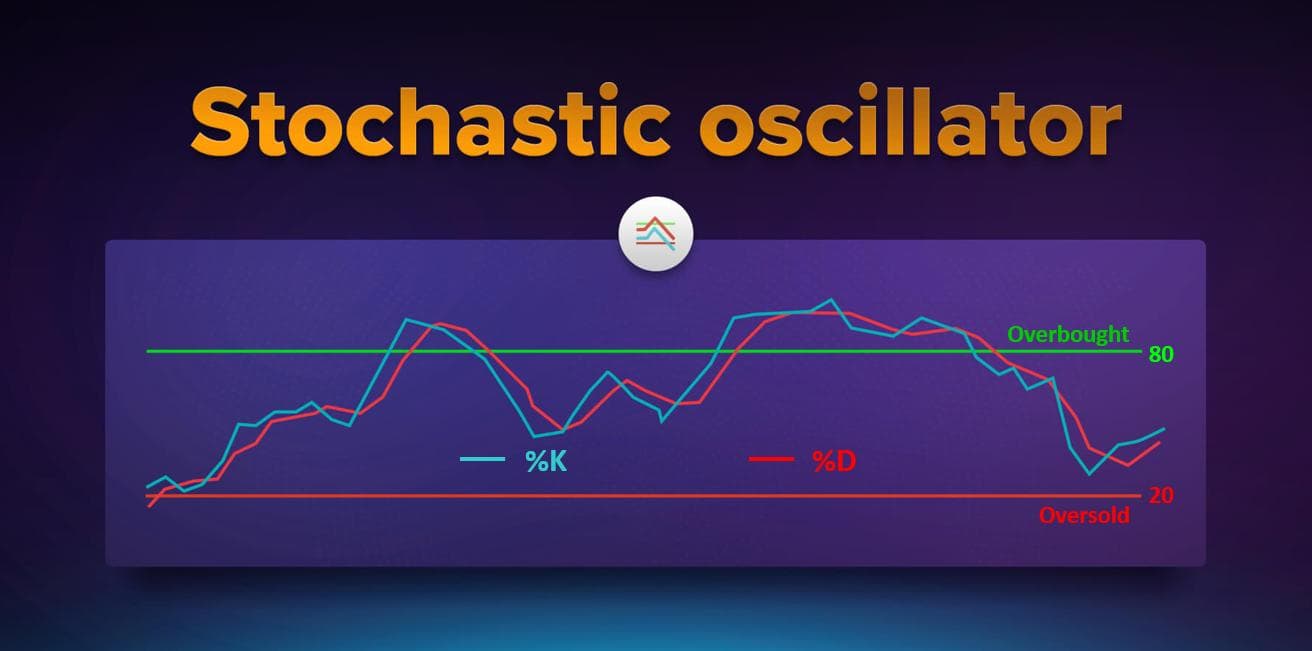
The stochastic oscillator measures the momentum of an asset’s price based on the observation that prices tend to close near their highs in an uptrend and near their lows in a downtrend. It generates a value between 0 and 100, indicating where the current closing price stands relative to the asset’s high-low range over a specified time period, usually 14 days.
This technical indicator is particularly valuable for identifying overbought conditions (where the price may soon decline) and oversold conditions (where the price may soon rise).
The stochastic oscillator is based on the mathematical concept of stochastic processes, which involve randomness or probability. In this context, “stochastic” refers to the random nature of price movements and how the indicator measures the probability of a security’s price closing near its high or low within a given period.
Stochastic Oscillator Formula and Calculations
Knowing how to calculate the stochastic oscillator is key to identifying precise entry and exit points.
Key Components
- %D Line: The %D line is a smoothed version of the %K line, calculated as the 3-period moving average of %K. This line is used to identify potential buy or sell signals when it crosses above or below the %K line.
- %K Line: The %K line represents the current value of the stochastic oscillator. It indicates the position of the most recent closing price relative to the high-low range over the specified period.
Formula
The basic formula for the stochastic oscillator is:
%K = {[Current Close − Lowest Low (n)] / [Highest High (n) − Lowest Low (n)]} × 100
The “%D” line is the 3-period moving average of %K.
Calculation Example
Suppose you are analyzing a stock with the following data over a 14-day period:
- Current Close: $50
- Lowest Low: $45
- Highest High: $55
Using the formula:
%K = [(50−45) / (55−45)] × 100 = (5/10) × 100 = 50%
This result means that the stock’s current close is at the 50% level of its recent price range.
What Is the Meaning of Stochastic 14 3 3?
“Stochastic 14 3 3” refers to the default settings for the stochastic oscillator, where “14” is the look-back period, “3” is the smoothing for the %K line, and the second “3” is the smoothing for the %D line.
Versions of Stochastic Oscillators
Fast Stochastic Oscillator
The fast stochastic oscillator is the original version, known for its high sensitivity to price changes. It reacts quickly to market movements, making it ideal if you’re looking to capitalize on short-term price fluctuations.
Slow Stochastic Oscillator
The slow stochastic oscillator is a smoothed version of the fast stochastic, designed to reduce noise and false signals. The smoothing process involves taking a 3-period moving average of the %K line, producing a slower, more reliable indicator. This version is preferable if you want to minimize the impact of market volatility.
Full Stochastic Oscillator
The full stochastic oscillator is the most customizable version, allowing you to adjust the look-back period and the smoothing settings for both the %K and %D lines. This flexibility makes it suitable for a wide range of trading strategies, from short-term to long-term analysis.
Interpreting Stochastic Oscillator Signals
Interpreting stochastic oscillator signals is vital for making well-timed and informed trading decisions. Here’s what to look for:
- Overbought and Oversold Levels: The stochastic oscillator identifies overbought conditions when the value exceeds 80 and oversold conditions when it falls below 20. An overbought signal suggests that the asset may be due for a price correction, while an oversold signal indicates that the asset may be undervalued and could rise.
- Crossovers: A crossover occurs when the %K line crosses above or below the %D line. When %K crosses above %D, it is typically seen as a buy signal, suggesting that the asset’s momentum is shifting upwards. Conversely, when %K crosses below %D, it indicates a potential sell signal.
- Divergences: Divergences between the price action and the stochastic oscillator can signal potential reversals. For example, if the price makes a new high, but the stochastic oscillator fails to do so, this could indicate that the momentum is weakening, and a price drop may follow.
Using Stochastics for Day Trading and Swing Trading
For day traders, the fast stochastic oscillator is one of the best technical indicators for day trading due to its sensitivity to price changes. It enables quick identification of short-term opportunities to enter or exit trades based on overbought or oversold conditions.
Swing traders often prefer slow or full stochastic oscillators as effective indicators for swing trading. The smoother lines help reduce false signals and provide a clearer view of medium-term trends and potential reversals.
Stochastic Oscillator vs. RSI
Both the stochastic oscillator and the Relative Strength Index (RSI) are popular momentum indicators, but they serve slightly different purposes.
The RSI measures the speed and change of price movements, typically over a 14-day period, to identify overbought or oversold conditions. The stochastic oscillator, on the other hand, compares the closing price to a specific price range over time. While you can use both indicators to identify potential reversals, the stochastic oscillator is often more sensitive to price changes, making it more suitable for determining entry and exit points in a shorter time frame.
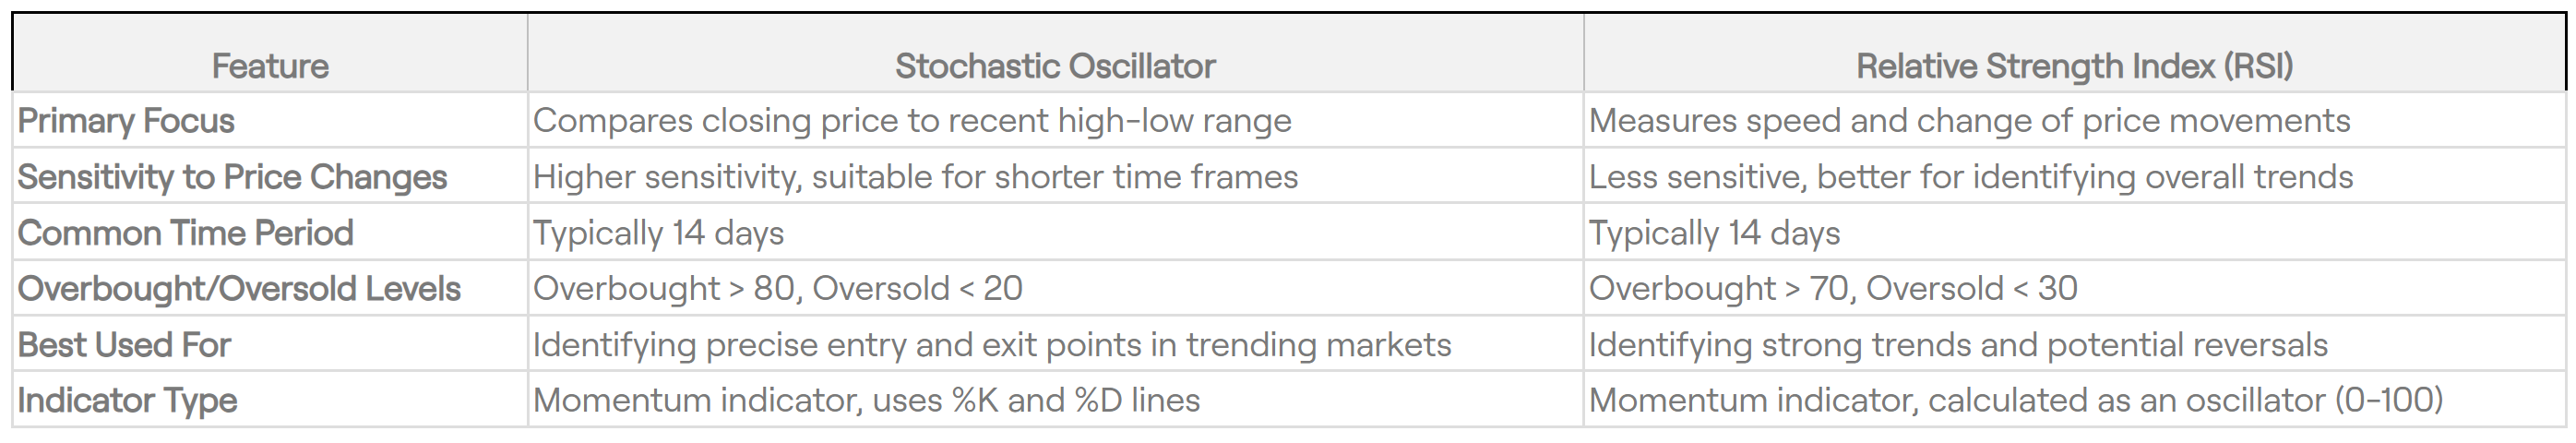
Which Is Better, RSI or Stochastic?
There is no definitive answer, as the choice between RSI and stochastic depends on your goals and the specific market conditions. The RSI may be preferred for identifying strong trends, while the stochastic oscillator is often used for spotting potential reversals in trending markets.
Understand and Profit From Asset Movements With Above the Green Line
By understanding stochastic oscillator calculations and interpretations, you can make more informed decisions and potentially increase your profitability. At Above the Green Line, we offer resources and memberships to help you master technical indicators like the stochastic oscillator and apply them effectively in your trading strategies. Explore our memberships to gain access to expert insights and tools that can elevate your trading performance.

Related Articles
[pt_view id=”9517038dwu”]