Dividend Growth Model
The Dividend Growth Model is a financial valuation tool used to estimate the intrinsic value of a stock based on the present value of its expected future dividends. It is rooted in the principle that the value of a stock is fundamentally tied to the income it generates for its shareholders in the form of dividends. In its basic form, the model assumes a constant growth rate in dividends over an extended period and is particularly favored by investors seeking income and employing a long-term investment strategy.
Several related subjects and concepts are associated with the Dividend Growth Model. Understanding these topics can provide a more comprehensive view of dividend investing, financial valuation, and related strategies. Here are some subjects associated with the Dividend Growth Model:
- Dividend Investing:
Description: Dividend investing involves building a portfolio of stocks that pay regular dividends. Investors focus on companies with a history of stable and growing dividend payments, seeking a reliable income stream.
- Dividend Yield:
Description: Dividend yield is a financial metric calculated by dividing the annual dividend per share by the current stock price. It provides insight into the income generated by a stock relative to its market value.
- Dividend Policy:
Description: Dividend policy refers to a company’s approach to distributing profits to shareholders. It encompasses decisions on whether to pay dividends, the frequency of payments, and the consistency or variability of dividend amounts.
- Required Rate of Return:
Description: The required rate of return is the minimum rate of return an investor expects to earn for taking on the risk of investing in a particular asset. In the Dividend Growth Model, it is denoted by the symbol r and is used to discount future dividend cash flows.
- Discounted Cash Flow (DCF) Valuation:
Description: DCF valuation involves estimating the present value of future cash flows, including dividends, to determine the intrinsic value of an investment. The Dividend Growth Model is a specific type of DCF valuation.
- Time Value of Money:
Description: The time value of money is a financial principle that asserts that a sum of money has different values at different points in time. In the context of the Dividend Growth Model, it is reflected in the discounting of future cash flows.
- Capital Asset Pricing Model (CAPM):
Description: CAPM is a financial model used to determine the expected return on an investment, considering its risk and the risk-free rate. It is often used to estimate the required rate of return in the Dividend Growth Model.
- Earnings Per Share (EPS):
Description: EPS is a financial metric that represents a company’s profit allocated to each outstanding share of common stock. It is a key factor in assessing a company’s ability to sustain and grow dividends.
- Payout Ratio:
Description: The payout ratio is the proportion of earnings paid out as dividends. It is calculated by dividing the total dividends by the net income of a company. A sustainable and moderate payout ratio is often sought by dividend investors.
- Financial Statement Analysis:
Description: Financial statement analysis involves examining a company’s financial statements to evaluate its financial health and performance. Analysts use financial ratios, including those related to dividends, to assess a company’s stability and growth prospects.
- Portfolio Diversification:
Description: Portfolio diversification is the practice of spreading investments across different asset classes to reduce risk. Investors may incorporate dividend-paying stocks, analyzed using the Dividend Growth Model, to enhance income while managing risk.
- Market Conditions and Economic Outlook:
Description: External factors, such as economic conditions and market trends, can impact dividend-paying stocks. Understanding broader market conditions and economic outlooks is crucial for making informed decisions when applying the Dividend Growth Model.
These associated subjects contribute to a holistic understanding of dividend-focused investment strategies and financial analysis, complementing the principles of the Dividend Growth Model.
Basic Form of the Dividend Growth Model
The Gordon Growth Model, a common variation of the Dividend Growth Model, is expressed as follows:
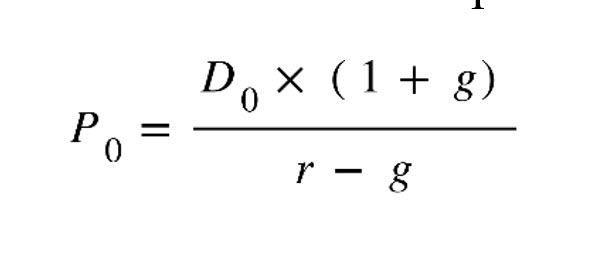
Where:
P0 – is the current stock price,
D0 – is the most recent dividend Payment,
g – is the expected constant growth rate of dividends, and
r – is the required rate of return or discount rate.
While the Gordon Growth Model is a common and straightforward variation of the Dividend Growth Model, there are other variations and adaptations that investors and analysts may use based on specific circumstances. Here are a few notable variations:
Two-Stage Dividend Growth Model:
Description: This variation recognizes that a company’s dividend growth rate may not remain constant indefinitely. It divides the projection period into two stages, each with a different growth rate. The model allows for a higher initial growth rate followed by a more stable, lower growth rate.
Three-Stage Dividend Growth Model:
Description: Similar to the two-stage model, the three-stage model extends the concept by incorporating three distinct stages of dividend growth. This is useful for companies with complex growth patterns, such as those experiencing rapid growth followed by stabilization and then perhaps a decline.
Multistage Dividend Discount Model (DDM):
Description: In a broader sense, a multistage DDM accommodates various growth rates over different periods. It may involve more than three stages and is flexible enough to capture complex scenarios in which the growth rate changes over time.
Constant Dividend Growth Model with Supernormal Growth:
Description: In some cases, companies may experience supernormal growth in dividends for a limited period before settling into a more stable growth pattern. This model incorporates a higher initial growth rate, which gradually decreases to a sustainable rate.
Earnings Retention Model:
Description: Instead of focusing solely on dividends, this model considers the retention of earnings for reinvestment in the business. It calculates the present value of future retained earnings and dividends, providing a more comprehensive valuation approach.
Free Cash Flow to Equity (FCFE) Model:
Description: This model shifts the focus from dividends to the free cash flows available to equity investors. It considers cash flows that can be distributed as dividends or used for share buybacks, debt reduction, or other activities that benefit shareholders.
Dividend Discount Model for Non-Dividend Paying Stocks:
Description: Some companies, especially in the technology sector, may not pay dividends. In such cases, analysts may modify the Dividend Growth Model to consider alternative cash flow measures, like free cash flow, or adjust the assumptions to fit the company’s characteristics.
Growth Rate Adjustments for Sustainable Payout Ratio:
Description: This variation adjusts the dividend growth rate based on the sustainable payout ratio, which is the portion of earnings a company can afford to distribute as dividends while maintaining financial health.
It’s important to note that the choice of a particular variation depends on the characteristics of the company being analyzed and the assumptions made by the analyst. Additionally, these variations may involve more complex calculations and may require additional data inputs. The variations also reflect the adaptability of the
Dividend Growth Model to different scenarios, accommodating the nuances of companies with diverse growth patterns and financial structures. Analysts often choose the model that best fits the circumstances and available information.

Related Articles
[pt_view id=”b47aec5l7b”]