
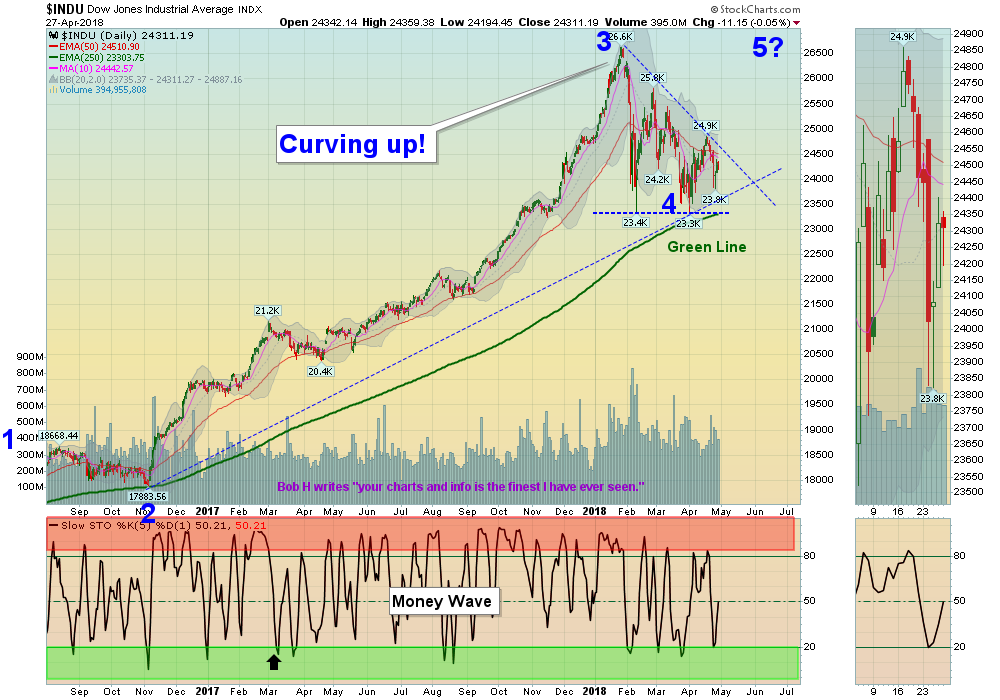
04/29/2018: Markets were mixed for the week, but the Indices were able to bounce at the 62% Retracement level on the recent decline. The Markets are trading between the Red Lines and Green Lines, until a DECISION is made (Up or Down).
Earnings are coming out, so maybe the Higher Low by the Indices will begin a re-test the Jan Highs. The recent Higher Low has not convinced most that the Selling is over. The Long Term Trend is UP.
The Inflation Index (CRB) is near the Highs this week at 201.39, and is now in a mild Up-Trend.
Bonds are bearish (Below the Green Line and Low Relative Strength) but bounced recently near Support of the February Lows.
The US DOLLAR has broken above a longer term Down Trend line, and is almost back up to the Green Line. This has put pressure on the Tech Stocks.
Crude Oil was down 0.44% for the week at $68.10, and GOLD was down 1.11%.
___________________________________________________________________________________________
MONEY WAVE BUYS SOON: We are currently in 6 logged Open Positions, for the Short & Medium Term. There are 2 Investments on the Short Term Watch List. Be patient and WAIT for Green Zone Buys!
______________________________________________________________________________________________
LONG TERM TRADES
The Funds below are correcting down to their Green Lines, but the Relative Strength is remaining high. These tend to Bounce nicely when the weekly Money Wave crosses up > 20.
ARRY ARRAY BIOPHARMA Wait for Weekly Money Wave Close > 20.
SMH SEMICONDUCTOR FUND Wait for Weekly Money Wave Close > 20.
TCEHY TENCENT HOLDINGS Wait for Weekly Money Wave Close > 20.
REMX RARE EARTH FUND Buy Above Blue Down Trend Line on Weekly.
___________________________________________________________________________________________
Click for Portfolio (Open Positions)
Click for Watch List
Click for Closed Positions
Alert! Market Risk is Medium (Yellow Zone). The probability of successful Short Term Trades is higher, when the S&P 500 is down near the Green Line.
Tell your Friends about the Green Line, and Help Animals.
QUESTION: Greg writes: “I would like an estimate of the normal/usual number of open positions so I know how to allocate my resources. Thanks,”
ANSWER: Hi Greg, and thank you for subscribing! Normally the number of Open Positions is 4-7. Recently it has been higher, as the Markets were very Over-Sold last month.
Good trading, and tell your friends!


