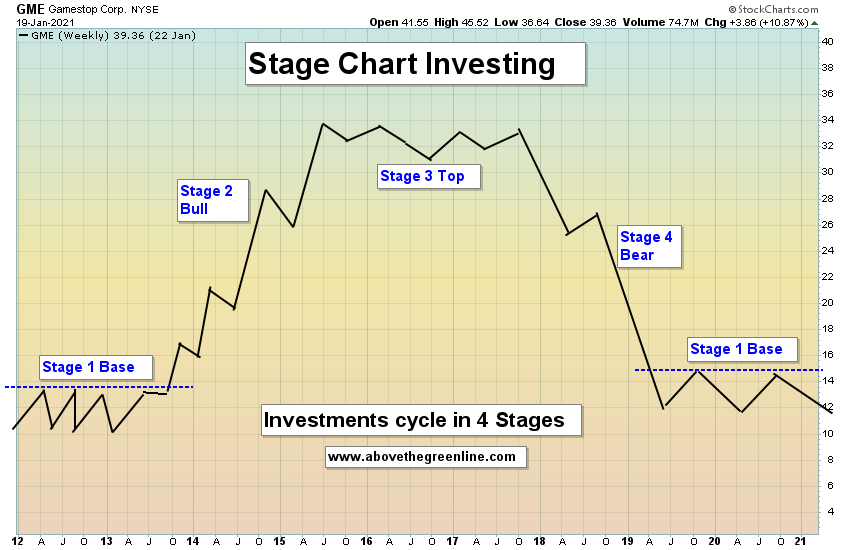
We follow the Stage Chart Analysis of Stan Weinstein… And you should read his book Secrets For Profiting in Bull and Bear Markets for timeless Technical Analysis (digital copy only $1.99 at Amazon). At least read Chapter 2.
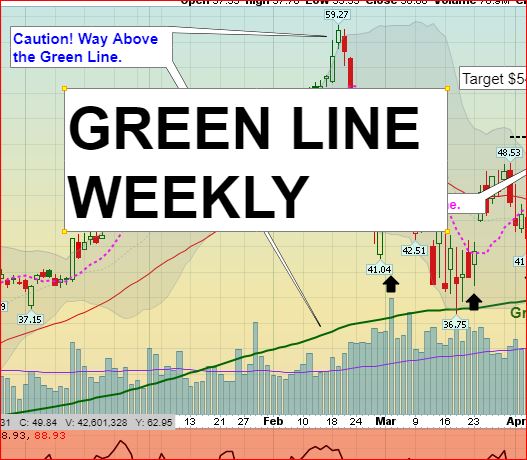
Most Stocks and Bonds currently are very High historically, and are well into Stage 2 (See Charts below) of a 12 year Bull in Stocks & (Bonds might be entering Stage 3 after 40 year unbelievable BULL).
Commodities, Interest Rates and Inverse Funds are in Stage 1 Base and could Double or Triple in the next BULL, based on History.