• Market Insights
        • Commentary
          • Daily
          • Weekly
        • BUY / SELL SIGNALS
          • Trade Posts
          • Recent Trade Alerts
          • Recent Day Trades
        • BLOGROLL
          • Dividend Growth Blog
          • ETF Sector Blog
          • Dow Dogs
          • TPOW Blog
  • Strategies
        • SWING TRADING
          • Current Positions
          • Watchlists
          • Closed Positions
          • Candidates - TOP 100
          • Specialty Stocks
        • WEEKLY STOCK PICK
          • TPOW Charts
          • TPOW Performance
          • TPOW Strategy Guide
          • TPOW Performance Dashboard
        • DAY TRADING
          • Watch List
        • ATGL DASHBOARD
        • ETF STRATEGIES
          • ETF Sector Rotation
          • ETF Sector Portfolio
        • DIVIDEND GROWTH
          • Dividend Growth Portfolio
          • Dividend Calendar
        • DOGS OF THE DOW
          • Dogs of the Dow Portfolio
          • DOW 5 Portfolio
  • Markets
        • US MARKET
          • Commodities
          • Energy
          • Precious Metals
          • Volatility
        • GLOBAL MARKETS
          • Market Indices
          • Economic Calendar
          • FOREX Heat Map
          • FOREX Cross Rates
          • Crypto Currency Market
  • Investing
    • Discord Community
    • Dashboard
  • Resources
        • ARTICLES
          • Dividend Growth Model Articles
          • ETF Articles
          • Investment Strategies Articles
          • Market and Economic Insights
          • Stock Trade Articles
          • Stock Reviews
        • TOOLS
          • Stock Scanners
          • Charting Software
          • Brokerage Firms
        • STOCK CHARTS
          • Key Components
          • Reading Charts
          • Drawing Stock Charts
          • Identifying Trends
        • RETIREMENT PLANNING
  • About
    • Contact Us
    • How to Win
    • #1 At Stockcharts
    • Disclaimer
    • FAQ
  • Log In
  • Subscribe
Menu
  • Market Insights
    • Commentary
      • Daily
      • Weekly
    • BUY / SELL SIGNALS
      • Trade Posts
      • Recent Trade Alerts
      • Recent Day Trades
    • BLOGROLL
      • Dividend Growth Blog
      • ETF Sector Blog
      • Dow Dogs
      • TPOW Blog
  • Strategies
    • SWING TRADING
      • Current Positions
      • Watchlists
      • Closed Positions
      • Candidates – TOP 100
      • Specialty Stocks
    • DAY TRADING
      • Watch List
    • WEEKLY STOCK PICK
      • TPOW Charts
      • TPOW Performance
      • TPOW Strategy Guide
      • TPOW Performance Dashboard
    • DIVIDEND GROWTH
      • Dividend Growth Portfolio
      • Dividend Calendar
    • DOGS OF THE DOW
      • Dogs of the Dow Portfolio
      • DOW 5 Portfolio
    • ETF STRATEGIES
      • ETF Sector Rotation
      • ETF Sector Portfolio
    • ATGL DASHBOARD
  • Markets
    • US MARKET
      • Commodities
      • Energy
      • Precious Metals
      • Volatility
    • GLOBAL MARKETS
      • Market Indices
      • Economic Calendar
      • FOREX Heat Map
      • FOREX Cross Rates
      • Crypto Currency Market
  • Investing
    • Discord Community
    • Dashboard
  • Resources
    • ARTICLES
      • Dividend Growth Model Articles
      • ETF Articles
      • Investment Strategies Articles
      • Market and Economic Insights
      • Stock Trade Articles
      • Stock Reviews
    • TOOLS
      • Stock Scanners
      • Charting Software
      • Brokerage Firms
    • STOCK CHARTS
      • Key Components
      • Reading Charts
      • Drawing Stock Charts
      • Identifying Trends
    • RETIREMENT PLANNING
  • About
    • Contact Us
    • How to Win
    • #1 At Stockcharts
    • Disclaimer
    • FAQ
  • Log Out
    • Members-Page
    • Referral
  • Log In
  • Subscribe
Log In
Log Out
Subscribe

April 30, 2017

Weekly Commentary Apr 30, 2017

NYSE Chart

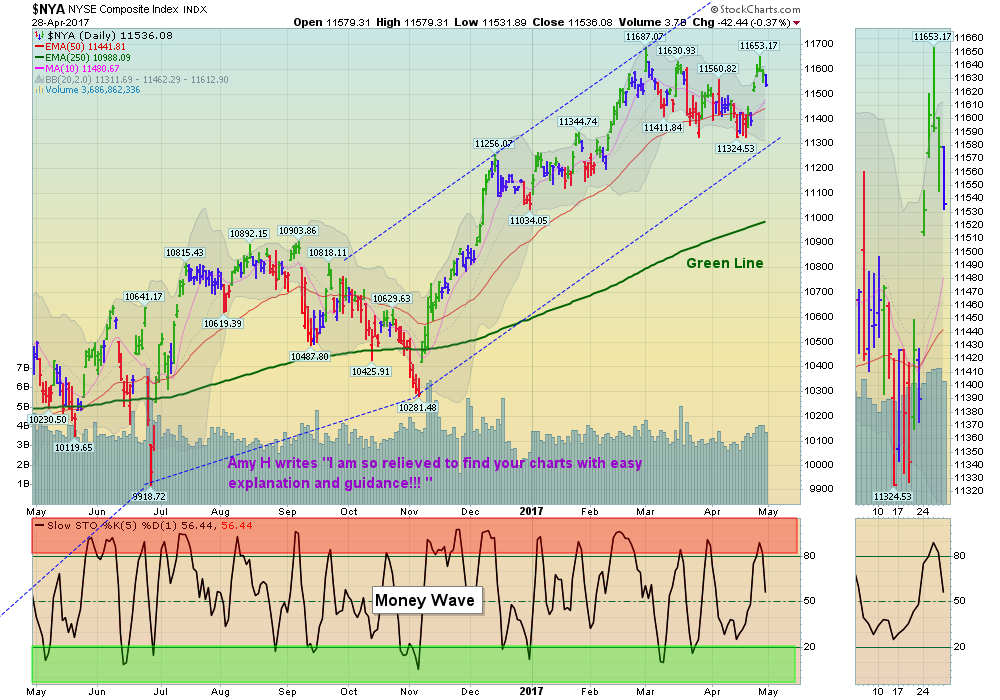
The New York Index is Struggling back up to the March Highs.

04/30/2017:  Markets were up for the week, as the Strongest Leaders made New Highs.  The weaker Indices (Dow, NYSE Financials & Transports) have not made it back up to the March Highs, indicating a lack of Buyers. Eventually the Markets will not make New Highs, and return back to the Green Lines, (like they always do).

Currently the S&P held at Support above 2322, and has made a  “W” pattern back up to the March Highs again. Watch out for a possible “Double Top”. Also please be patient, as the Trump Rally has not had a good pull-back yet. Short Term Trading should get better once some better selling comes in…

Bonds have rallied all the way back up to the Green Line, indicating either War Fears, or expectations of a Slowing Economy…

Commodities are weak, indicating expectations of a slowing Economy.


MONEY WAVE BUYS SOON:    There are currently 9 Open Positions,  and 0 Investments are on the Watch List. 

ON DECK to Buy soon:  Watch List.  Wait for GREEN ZONE BUYS.  We will email or text when they are ready.  


LONG TERM TRADES – We are looking for a good Entry Point for these, which could possibly Double:

DBC   COMMODITY FUND   Waiting for Break Out Above $16.08.
IPI    INTREPID POTASH    Waiting for Break Out Above $3.04.
JJC     COPPER FUND            Waiting on a Pull-back.
KOL    COAL FUND         Waiting for a Pull-back.
MDR    MCDERMOTT INT’L.  Waiting for Bounce Up & Above 90 Relative Strength.
UGA   US GASOLINE FUND   Waiting on Break Out Above $32.03.
WFM   WHOLE FOODS MARKET   Waiting on a Pull-back.


Click for  Portfolio (Open Positions)  
Click for  Watch List
Click for  Closed Positions

Alert! Market Risk is High (Red Zone). The probability of successful Short Term Trades is lower, when the S&P 500 is Way Above the Green Line. Even the Strongest Funds can get chopped up. Either take quick gains from Money Wave Pops, or STAY IN CASH & WAIT for a larger correction.

[s_static_display]

Tell your Friend about us, and HELP ANIMALS.

QUESTION: Dominick writes ” I was wondering after looking at all the charts,  do we take trades that have clear bearish technical patterns, or since the sctr is above 90, we take the sto when it drops below 20, buy after cross over?”

ANSWER: Don’t try to Short the Investments that have High relative Strength, Dominick. It usually does not work well, as Strong Investments can Correct Sideways, and then go much Higher. It is Safer to Buy the Leaders on pull-backs only.

If you want to Sell Short, Reverse the Green Line Rules (Below the G L, Below 10 RS, and Money Wave < 80).

Related Post

– Weekly Commentary Apr 23, 2017

Investing with Rules.

On ATGL

  • DashBoard
  • Weekly Commentary
  • Daily Buy / Sell Signals
  • Day Trade Setup
  • Trading Rooms

Strategies

  • Swing Trading
  • ATGL Pick of the Week
  • Dividend Growth
  • ETF Sector Rotation
  • Dogs of the Dow

Help

  • ATGL Trading Rules
  • FAQ
  • Account Maintenance
  • Contact US
  • Join

Stay Updated

No credit card required. Unsubscribe anytime

Check your inbox or spam folder to confirm your subscription.

© 2024 Above The Green Line. All rights reserved.

  • Twitter
  • LinkedIn
  • YouTube