The Relative Strength Index (RSI) is a momentum indicator used in technical analysis.
Key Takeaways
The relative strength index (RSI) is a popular momentum oscillator developed in 1978.
The RSI provides technical traders signals about bullish and bearish price momentum, and it is often plotted beneath the graph of an asset’s price.
An asset is usually considered overbought when the RSI is above 70% and oversold when it is below 30%.
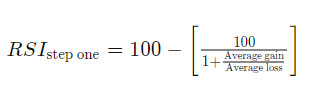
The RSI is calculated in two steps by first calculating the RSI as shown below. Next, once there are 14 periods (data points) available, the second step smooths the results by using the averages over the prior lookback period. Using the RSI as calculated, the RSI line is typically plotted beneath a securities price chart to highlight swings.