
HAPPY EASTER TO ALL!
04/21/2019: Markets were mixed again for the week, as the major Indices are back up near the Sept. Highs. Normally Indices will struggle at previous Highs (Resistance), and the Markets have quickly rallied 24 % up from the Dec. Lows without much pull-back.
For the week the Dow was up 0.56%, the S&P 500 was down 0.05%, and the Nasdaq 100 was up 0.81%. The very Long Term Trend on the Stock Markets is UP.
The Inflation Index (CRB) was down 0.65% and is slightly Above the Green Line, indicating Economic Strength.
Bonds were up 0.19% for the week and are Above the Green Line, indicating Economic Weakness.
The US DOLLAR was up 0.65% and is over-bought.
Crude Oil was up 0.28% for the week at $64.07, and GOLD was down 1.48% at $1276.
___________________________________________________________________________________________
MONEY WAVE BUYS SOON:
We are currently in 7 logged Open Positions, for the Short & Medium Term. There are 5 Investments on the Short Term Watch List.
Be patient and WAIT for Green Zone Buy Signals!
______________________________________________________________________________________________
LONG TERM TRADES
Buy the Leading Investments that are down near the weekly Green Zones.
AVP AVON PRODUCTS Buy if is Closes above $3.41 on High Volume.
BSX BOSTON SCIENTIFIC Wait for a Close above the Red Line of $38.00.
CIEN CIENA CORP. Wait for a Close above the Red Line of $38.20.
DXCM DEXCOM INC. Wait for a Close above the Red Line of $128.52.
KTOS KRATOS DEFENSE Wait for a Close above the Red Line of $15.54.
MEET THE MEET GROUP Wait for a Close above the Red Line of $5.30.
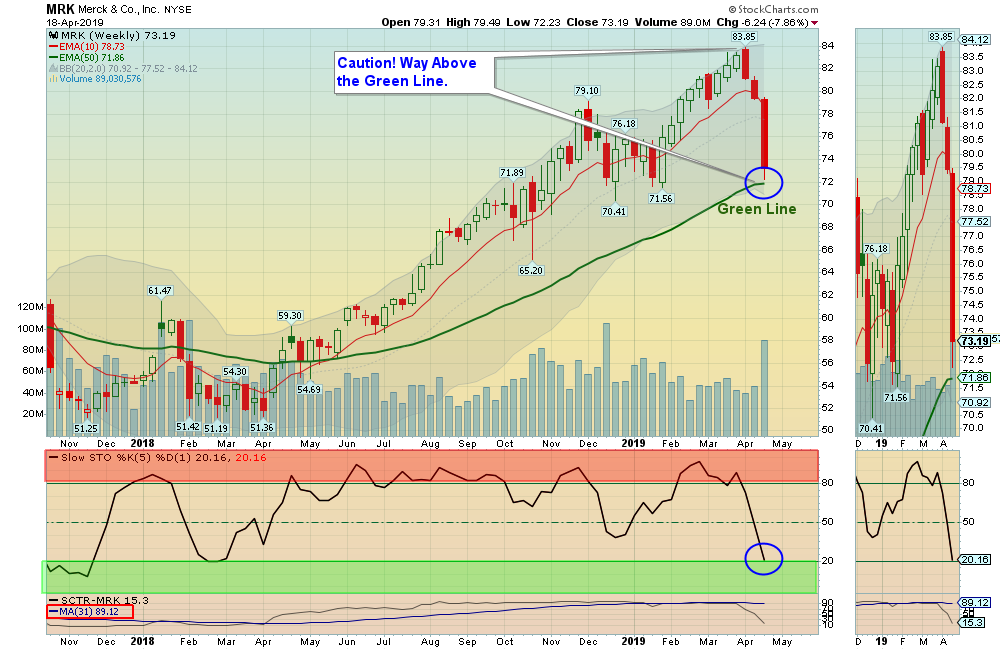
MRK MERCK & CO. Wait for next Daily Money Wave Buy Signal.
___________________________________________________________________________________________
Click for Portfolio (Open Positions)
Click for Watch List
Click for Closed Positions
Alert! Market Risk is HIGH (Red Zone). The probability of successful Short Term Trades is better, when the % of stocks above the 50-day avg. is below 20.
Tell your Friends about the Green Line, and Help Animals
4 Ways to Get your Daily Money Wave Alert:
- Emailed to your box between 3:30 3:50pm EDT.
- Website menu Commentary/Buy/Sell Signals
- Free Twitter notifications are the fastest and most reliable @AboveGreenLine
- Text messages: Email us your Cell number & phone carrier.


