• Market Insights
        • Commentary
          • Daily
          • Weekly
        • BUY / SELL SIGNALS
          • Trade Posts
          • Recent Trade Alerts
          • Recent Day Trades
        • BLOGROLL
          • Dividend Growth Blog
          • ETF Sector Blog
          • Dow Dogs
          • TPOW Blog
  • Strategies
        • SWING TRADING
          • Current Positions
          • Watchlists
          • Closed Positions
          • Candidates - TOP 100
          • Specialty Stocks
        • WEEKLY STOCK PICK
          • TPOW Charts
          • TPOW Performance
          • TPOW Strategy Guide
          • TPOW Performance Dashboard
        • DAY TRADING
          • Watch List
        • ATGL DASHBOARD
        • ETF STRATEGIES
          • ETF Sector Rotation
          • ETF Sector Portfolio
        • DIVIDEND GROWTH
          • Dividend Growth Portfolio
          • Dividend Calendar
        • DOGS OF THE DOW
          • Dogs of the Dow Portfolio
          • DOW 5 Portfolio
  • Markets
        • US MARKET
          • Commodities
          • Energy
          • Precious Metals
          • Volatility
        • GLOBAL MARKETS
          • Market Indices
          • Economic Calendar
          • FOREX Heat Map
          • FOREX Cross Rates
          • Crypto Currency Market
  • Investing
    • Discord Community
    • Dashboard
  • Resources
        • ARTICLES
          • Dividend Growth Model Articles
          • ETF Articles
          • Investment Strategies Articles
          • Market and Economic Insights
          • Stock Trade Articles
          • Stock Reviews
        • TOOLS
          • Stock Scanners
          • Charting Software
          • Brokerage Firms
        • STOCK CHARTS
          • Key Components
          • Reading Charts
          • Drawing Stock Charts
          • Identifying Trends
        • RETIREMENT PLANNING
  • About
    • Contact Us
    • How to Win
    • #1 At Stockcharts
    • Disclaimer
    • FAQ
  • Log In
  • Subscribe
Menu
  • Market Insights
    • Commentary
      • Daily
      • Weekly
    • BUY / SELL SIGNALS
      • Trade Posts
      • Recent Trade Alerts
      • Recent Day Trades
    • BLOGROLL
      • Dividend Growth Blog
      • ETF Sector Blog
      • Dow Dogs
      • TPOW Blog
  • Strategies
    • SWING TRADING
      • Current Positions
      • Watchlists
      • Closed Positions
      • Candidates – TOP 100
      • Specialty Stocks
    • DAY TRADING
      • Watch List
    • WEEKLY STOCK PICK
      • TPOW Charts
      • TPOW Performance
      • TPOW Strategy Guide
      • TPOW Performance Dashboard
    • DIVIDEND GROWTH
      • Dividend Growth Portfolio
      • Dividend Calendar
    • DOGS OF THE DOW
      • Dogs of the Dow Portfolio
      • DOW 5 Portfolio
    • ETF STRATEGIES
      • ETF Sector Rotation
      • ETF Sector Portfolio
    • ATGL DASHBOARD
  • Markets
    • US MARKET
      • Commodities
      • Energy
      • Precious Metals
      • Volatility
    • GLOBAL MARKETS
      • Market Indices
      • Economic Calendar
      • FOREX Heat Map
      • FOREX Cross Rates
      • Crypto Currency Market
  • Investing
    • Discord Community
    • Dashboard
  • Resources
    • ARTICLES
      • Dividend Growth Model Articles
      • ETF Articles
      • Investment Strategies Articles
      • Market and Economic Insights
      • Stock Trade Articles
      • Stock Reviews
    • TOOLS
      • Stock Scanners
      • Charting Software
      • Brokerage Firms
    • STOCK CHARTS
      • Key Components
      • Reading Charts
      • Drawing Stock Charts
      • Identifying Trends
    • RETIREMENT PLANNING
  • About
    • Contact Us
    • How to Win
    • #1 At Stockcharts
    • Disclaimer
    • FAQ
  • Log Out
    • Members-Page
    • Referral
  • Log In
  • Subscribe
Log In
Log Out
Subscribe

March 7, 2019

Money Wave Alert! Mar 7, 2019

DIA Chart
The DOW Index should bounce soon near the Red Line (50-day avg).


Markets were down again today as the S&P 500 broke below the Support of 2764. Next Support is the Red Line (50-day avg.) of  2715. 

The Leaders are slowly returning  back down to the Green Zones for Money Wave Buy Signals soon. The best trades usually happen when the S&P 500 Index is also coming up out of the Green Zone. 

Please be patient and WAIT for Money Wave Buy Signals.

Crude Oil was down $0.40  today at  $56.60. 

__________________________________________________________________________________________________

The Following Investments will probably have a Money Wave Buy Signal soon.
(Slow Stochastic Closing > 20) on today’s Close.


BUYS TODAY   


CROX    CROCS CORP.   (2nd Buy Signal)    Money Wave Buy today. Target is $29.00.   EXIT if it is going to Close below Support of  $24.23.


Money Wave Buys Signals Soon:   (Best to Buy when the S&P 500 is also in the Green Zone.)    

AU    ANGLOGOLD LTD.   

AVP    AVON PRODUCTS   

BA     BOEING CO.    Money Wave must Close in the Green Zone.

CIEN    CIENA CORP.     

CROX     CROCS CORP.   (2nd Buy Signal soon)

GFI    GOLF FIELDS LTD.    

ITUB    ITAU UNIBANCO     Medium Term Buy soon     

PBR     PETROBRAS ENERGY  (2nd Buy Signal soon).     


Please be patient and wait for Money Wave Buy Signals.  We will email you when they are ready. Click on Watch List.

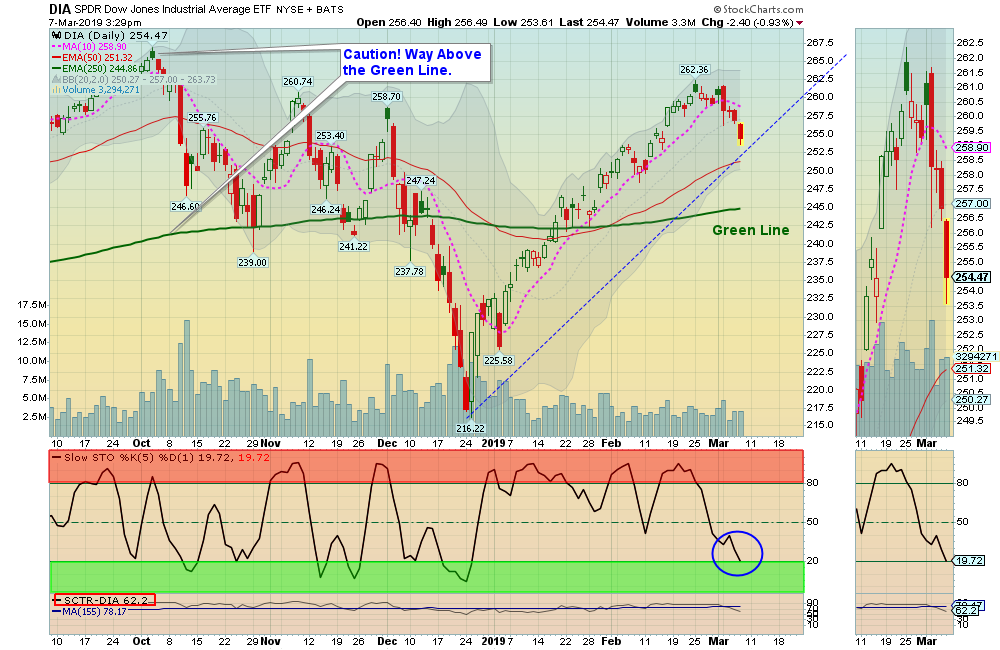
Emotions are very high now, so please do not Buy unless you are VERY NIMBLE. The Leaders are Way Above the Green Lines (all Investments eventually return to their Green Lines).

______________________________________________________________________________________


SELLS TODAY    


LOWER    AMD  ADVANCED MICRO    Sell Stop Loss to $21.73 on the Close.  AMD is in the Green Zone with 92 Relative Strength. 

LOWER    EWZ   BRAZIL FUND    Sell Stop Loss to $40.74 on the Close.  EWZ is in the Green Zone with 98 Relative Strength. 


EXIT    EIDO    INDONESIA FUND    if it is going to Close below Support of  $25.72.  This trade was not logged. 

EXIT    CGC   CANOPY GROWTH    if it is going to Close below the Pink Line around  $46.10.  This trade was not logged.


Please Check   PORTFOLIO  (Open Positions) and adjust your Sell Stops.

Click for  CLOSED POSITIONS.


Many like to Buy the day before, near the Close, if the Money Wave is going to create a Buy Signal (Closing > 20).

Don’t Buy if the Investment has already popped up too much. Money Wave Buys are usually good for a 3-6 %  move in a few days.

We will “Not Log” trades if the Reward/Risk is not at least 2:1.

Related Post

– Money Wave Alert! Mar 6, 2019

Subscribe to Our Newsletter

AGL Logo

Get our eBook Now!

Candlestick - A Swing Traders Friend

We don’t spam! Read our privacy policy for more info.

Check your inbox or spam folder to confirm your subscription.

Voted #1 at Stock Charts

SH Chart
Inverse S&P 500 Fund (SH) will have a Money Wave Buy today.

Help Us Help Animals

Help Us Help Animals

Recent Comments

  • AbovetheGreenLine on Green Line Weekly Aug 27, 2023
  • lbrodt on Green Line Weekly Aug 27, 2023
  • Mitch Van Zelfden on Money Wave Alert! Jul 31, 2023
  • AbovetheGreenLine on Money Wave Alert! Jul 31, 2023
  • Mitch Van Zelfden on Money Wave Alert! Jul 31, 2023

Become a Green Liner!

Help me make more Money in the Stock Market.

Investing with Rules.

On ATGL

  • DashBoard
  • Weekly Commentary
  • Daily Buy / Sell Signals
  • Day Trade Setup
  • Trading Rooms

Strategies

  • Swing Trading
  • ATGL Pick of the Week
  • Dividend Growth
  • ETF Sector Rotation
  • Dogs of the Dow

Help

  • ATGL Trading Rules
  • FAQ
  • Account Maintenance
  • Contact US
  • Join

Stay Updated

No credit card required. Unsubscribe anytime

Check your inbox or spam folder to confirm your subscription.

© 2024 Above The Green Line. All rights reserved.

  • Twitter
  • LinkedIn
  • YouTube