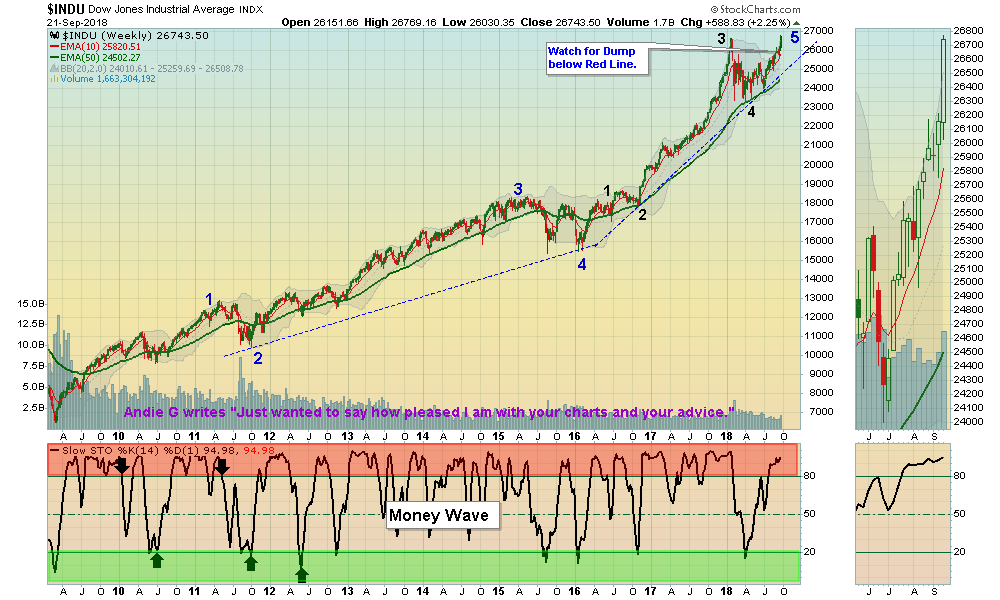
09/23/2018: Markets were up again this week, as the DOW Index finally exceeded the January Highs. However the Markets are over-bought, and it would be better trading for the Markets to correct some towards the Red Lines (50-day avgs.)
For the week the Dow was up 2.24%, the S&P 500 was up 0.84%, and the Nasdaq 100 was down 0.19%. The S&P 500 now has Support at the January Highs of 2872. The Long Term Trend on the Stock Markets is UP.
The Inflation Index (CRB) was up 1.83% and is Above the Green Line, indicating Economic Strength.
Bonds were down 1.22% for the week and Closed Below the Green Line, indicating Economic Strength.
The US DOLLAR was down 0.75% for the week, and slipped below the Red Line.
Crude Oil was up 2.59% for the week at $70.78, and GOLD was mixed at $1201.
___________________________________________________________________________________________
MONEY WAVE BUYS SOON:
We are currently in 5 logged Open Positions, for the Short & Medium Term. There are 5 Investments on the Short Term Watch List.
Be patient and WAIT for Green Zone Buys!
______________________________________________________________________________________________
LONG TERM TRADES
Most of the longer term favorites below are currently Below their Green Lines, as the Market Internals have narrowed. These tend to do well if they can Bounce up from the Green Lines.
ETFC E*TRADE FINANCIAL Wait for weekly Close Above the Red Line of $57.72 (50-day avg.)
HEAR TURTLE BEACH CORP. Wait for Weekly Money Wave Close > 20.
INTC INTEL CORP. Wait for weekly Close Above the Red Line of $47.92 (50-day avg.)
MU MICRON TECH Wait for weekly Close Above the Red Line of $48.87 (50-day avg.)
THC TELNET HEALTHCARE Wait for Weekly Money Wave Close > 20.
TWTR TWITTER, INC. Wait for weekly Close Above the Red Line of $33.09 (50-day avg.)
URBN URBAN OUTFITTERS Wait for Weekly Money Wave Close > 20.
WTW WEIGHT WATCHERS Wait for weekly Close Above the Red Line of $76.34 (50-day avg.)
___________________________________________________________________________________________
Click for Portfolio (Open Positions)
Click for Watch List
Click for Closed Positions
Alert! Market Risk is High (RedZone). The probability of successful Short Term Trades is better, when the S&P 500 is down near the Green Line.
Tell your Friends about the Green Line, and Help Animals.
4 Ways to Get your Daily Money Wave Alert:
- Emailed to your box between 3:30 3:50pm EST.
- Website menu Commentary/Buy/Sell Signals
- Twitter notifications @AboveGreenLine (fastest and most reliable)
- Text messages: Email us your Cell number & phone carrier.


