#1 Public Site at Stockcharts.com.
The Green Line System can help you make more Money in the Stock Market!
We Buy the Strongest Stocks & ETFs on the Dips. Then they will normally go back up to retest the recent Highs.
Are You Able to Keep Up With the Flow of Money Into & Out of Markets? Technology & Filtering can give you the EDGE to win!
We Only follow the STRONGEST Investments. How? Just Follow these 3 Rules:
1. Only Buy Investments that are Above the Green Line. (250 day avg.)
2. Only Invest Above 90 Relative Strength Factor (Top 10% of All Investments).
3. The Money Wave Indicator should be < 20 and turning up (Buy in Green Zone, Sell in Red Zone).
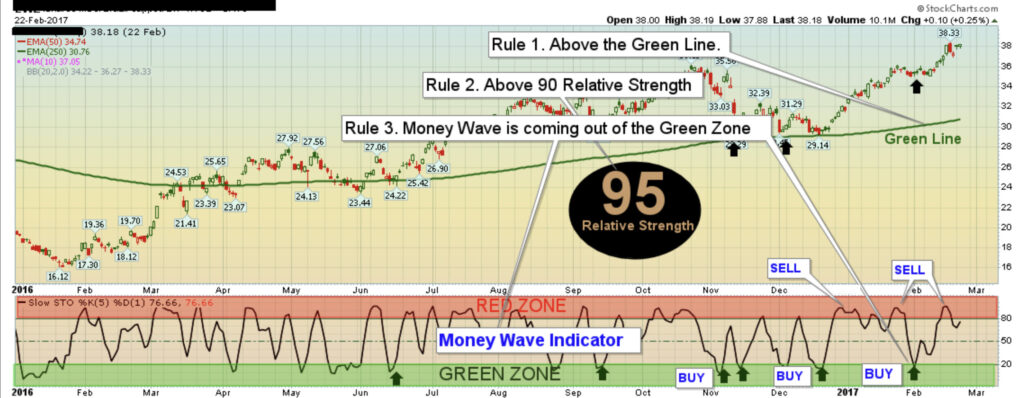
KEEP IT SIMPLE: Buy in Green Zone, Sell in Red Zone.
We are Master Swing Traders, and we will email, tweet, or text you when to Buy, just before the Market Closes. Buy them when they are coming up out of the Green Zone, and take profits in the Red Zone. Split your account into 5-10 positions. The daily email or Tweet will have Buy Entry Points, Target, and Sell Stop Losses for you. Then follow them on your Positions Page.
Top Pick of the Week – Buy on Monday and Sell on Friday (very popular).
Day Trading Alerts will be sent out with Discord Trading Hub, X (Twitter) and on our Live Trading Room.
Recent Completed Swing Trades
Lots of Small Swing Trade Gains Can Add Up!
| Star Rating | Open Date | Symbol | Description | Purchase Price | Sell Date | Sell Price | Net Profit | Realized Gain/Loss % | id | Strategy | Position | ATGL Rule | Industry | SCTR | Size | Comments | Stop Loss | color | Chart | Update Date | Status | Last Price | Unrealized Gain/Loss % | Daily Change % | Volume | Post Type | ATGL 60 Min | # Shares | Amount Invested | Portfolio Weight | Dividend Rate | Current Yield | Current Value | Yield on Cost | Projected Annual Dividends | Total Dividends Received | Pay Back | Profit / Loss | Annualized Profit/Loss |
|---|---|---|---|---|---|---|---|---|---|---|---|---|---|---|---|---|---|---|---|---|---|---|---|---|---|---|---|---|---|---|---|---|---|---|---|---|---|---|---|
| 2025-04-23 | INOD | Innodata Inc. | $34.39 | 2025-04-28 | $38.00 | $3.61 | 10.50% | 4582 | Short Term | Long | DON’T TAKE A LOSS! | HealthCare | 94 | Small | Apr 28 Sold via email at $38 for 10.5 % Gain | 34.39 | https://stockcharts.com/sc3/ui/?s=INOD&a=1912793594&p=D&yr=0&mn=6&dy=0&id=p15011524927 | 2025-04-30 17:23:09 | close | $37.02 | -1.44% | 515198 | Trade | $0 | 0.00% | $0 | 0.00% | $0 | $0 | 0.00% | 0.00% | - | |||||||
| 2025-04-16 | SH | Inverse S&P 500 Fund | $46.75 | 2025-04-22 | $46.75 | $0.00 | 0.00% | 4579 | Short Term | Long | DON’T TAKE A LOSS! | index | 90 | ETF | Apr 22 Slipped down to the Buy Price and was Stopped Out even. | 46.75 | https://stockcharts.com/sc3/ui/?s=SH&a=1952895963&p=D&yr=0&mn=4&dy=0&id=p38653436068 | 2025-04-23 13:40:40 | close | $45.55 | -2.36% | 223218 | Trade | $0 | 0.00% | $0 | 0.00% | $0 | $0 | 0.00% | 0.00% | - | |||||||
| 2025-04-14 | LX | LexinFintech Holdings | $7.22 | 2025-04-24 | $8.25 | $1.03 | 14.27% | 4576 | Short Term | Long | DON’T TAKE A LOSS! | 96 | Small | Apr 24 Stopped Out by email at $8.25 for 14.3 % Gain. | 8.25 | https://stockcharts.com/sc3/ui/?s=LX&a=1949458932&p=D&yr=0&mn=6&dy=0&id=p30813991236 | 2025-05-09 18:55:48 | close | $7.81 | -3.58% | 1165521 | Trade | $0 | 0.00% | $0 | 0.00% | $0 | $0 | 0.00% | 0.00% | - | ||||||||
| 2025-04-10 | EXC | Exelon Corp. | $45.12 | 2025-04-17 | $47.50 | $2.38 | 5.27% | 4575 | Short Term | Long | STOP BELOW PINK LINE | Energy | 94 | Mid | Apr 17 Target was Hit at $47.50 with a 5.3% Gain. | 46.53 | https://stockcharts.com/sc3/ui/?s=EXC&a=1948533925&p=D&yr=0&mn=6&dy=0&id=p06064869793 | 2025-04-24 21:56:38 | close | $46.33 | -1.00% | 7599574 | Trade | $0 | 0.00% | $0 | 0.00% | $0 | $0 | 0.00% | 0.00% | - | |||||||
| 2025-04-10 | CME | CME Group | $258.39 | 2025-04-23 | $256.64 | -$1.75 | -0.68% | 4577 | Short Term | Long | DON’T TAKE A LOSS! | Financial | 98 | Mid | Apr 23 Slipped down below the Buy Price and was Stopped out at $256.64. | 258.39 | https://stockcharts.com/sc3/ui/?s=CME&a=1948534009&p=D&yr=0&mn=6&dy=0&id=p14831321548 | 2025-04-27 21:26:12 | close | $266.30 | 1.15% | Trade | $0 | 0.00% | $0 | 0.00% | $0 | $0 | 0.00% | 0.00% | - | ||||||||
| 2025-04-09 | LYG | Lloyd's TSB Group PLC | $3.51 | 2025-04-14 | $3.70 | $0.19 | 5.41% | 4572 | Short Term | Long | STOP BELOW PINK LINE | 90 | Mid | Apr 14 Target was Hit at $3.70 for a 5.4 % Gain,(Buy adjusted for $0.10 Dividend). | 3.87 | https://stockcharts.com/sc3/ui/?s=LYG&a=1915484057&p=D&yr=0&mn=6&dy=0&id=p89656994647 | 2025-05-06 16:20:11 | close | $3.86 | 1.72% | 10985945 | Trade | $0 | 0.00% | $0 | 0.00% | $0 | $0 | 0.00% | 0.00% | - | ||||||||
| 2025-04-09 | IAU | Gold Fund | $58.38 | 2025-04-10 | $59.08 | $0.70 | 1.20% | 4573 | Short Term | Long | STOP BELOW PINK LINE | Metals | 98 | ETF | Apr 10 Target was Hit at $59.08 with a 1.2% Gain. | 62.35 | https://stockcharts.com/sc3/ui/?s=IAU&a=1663048452&p=D&yr=0&mn=6&dy=0&id=p83753185125 | 2025-04-27 15:15:48 | close | $62.34 | -1.11% | 8256491 | Trade | $0 | 0.00% | $0 | 0.00% | $0 | $0 | 0.00% | 0.00% | - | |||||||
| 2025-04-09 | GILD | Gilead Sciences Inc. | $105.25 | 2025-04-29 | $105.25 | $0.00 | 0.00% | 4574 | Short Term | Long | DON’T TAKE A LOSS! | HealthCare | 95 | Large | Apr 29 Slipped down to the Buy Price and was Sold at break even. | 105.25 | https://stockcharts.com/sc3/ui/?s=GILD&a=1922447695&p=D&yr=0&mn=6&dy=0&id=p84055110959 | 2025-04-29 21:09:57 | close | $104.21 | -2.00% | 8777485 | Trade | $0 | 0.00% | $0 | 0.00% | $0 | $0 | 0.00% | 0.00% | - | |||||||
| 2025-04-07 | QBTS | D-Wave Quantum | $6.60 | 2025-04-11 | $7.35 | $0.75 | 11.36% | 4559 | Short Term | Long | STOP BELOW PINK LINE | Tech | 99 | Small | Apr 11 Sold by email at $7.35 for 11.4 % Gain. | 7.35 | https://stockcharts.com/sc3/ui/?s=QBTS&a=1856574637&p=D&yr=0&mn=4&dy=0&id=p53683975200 | 2025-04-16 22:06:45 | close | $6.44 | -6.94% | 27100137 | Trade | $0 | 0.00% | $0 | 0.00% | $0 | $0 | 0.00% | 0.00% | - | |||||||
| 2025-04-02 | RGTI | Rigetti Computing | $8.49 | 2025-04-30 | $8.49 | $0.00 | 0.00% | 4562 | Short Term | Long | DON’T TAKE A LOSS! | Tech | 99 | Small | Apr 29 Slipped Down to the Buy Price, and was Stopped Out even.. | 8.49 | https://stockcharts.com/sc3/ui/?s=RGTI&a=1853390941&p=D&yr=0&mn=4&dy=0&id=p62938096156 | 2025-05-01 03:35:23 | close | $8.87 | 0.11% | Trade | $0 | 0.00% | $0 | 0.00% | $0 | $0 | 0.00% | 0.00% | - |
Help me make more Money in the Stock Market

Please send some profits to help animals (ASPCA).

Disclaimer: The information provided herein is not to be construed as an offer to buy or sell Investments of any kind. The Investment selections on this website are not to be considered a recommendation to buy or sell any Investment but as is a mere form of expression of the writer. All information offered by Above the Green Line is for educational purposes only. Readers are urged to check with their own investment counselor before making any investment decisions.
Thank you. Your Charts are amazing!
Thank you. I appreciate that you asked about the options for fees some time ago, and as a small investor, I appreciate your decision on this, and signed up as soon as I saw your e-mail.
SteveN
Great! We hope you enjoy!
Good trading, and tell your friends!
Dr. John writes on Sep 21th “Please keep up your excellent work.
Many thanks”.
John.
I have been following your charts for years , and I am thrilled withyour newsletter. My biggest problem with investing has been when to sell.
I joined stockcharts for a short period, but could not figure out how to set up the scanning . Can you help in any way?or tell me who at Stockcharts
could assist me ?
Ihave a portfolio of long term stocks that I have held for many,many years, reinvesting the dividends, I dont need the dividends, but, I hate to see myself
lose the capital as Ive done twice before in 2000, 2008 , and this bubble is scaring me. I was able to make up the loses, but now I am semi retired..
Donald Trump said “our economy is in real trouble folks, we are in a bubble in the stock market and in real estate and I just hope the disaster hits before I take office”. Also with $19 + trillion in debt it seems inevitably disasterous. Trump is going to be a great President in my opinon, but I’m afraid we are over the top.
Any thoughts? I am aware of tax consequences, but ……
Thanks for all the help and your part in
I have taken all steps to protect myself with hard assets, but justworried about my capital in stocks right now.
Great Question!
Since the current 8 year Bull Market is the second longest in history, it would be unrealistic to expect much more Upside, before a DUMP.
Follow the Long Term Green Line Rules (Above the Green Line + Above 90 Relative Strength. Check your Investments HERE.
If you do nothing, eventually the Markets will begin to discount the next Recession, and you could see another 35-45% drop.
Smart Money is Selling to the HERD now, so they can BUY BACK when Stocks are on Sale… Eventually Inverse Funds will meet the Rules and have another nice run up like in 2008.
AMD still rising, I set my stop high 13’s last Thursday. Stop up to mid 14’s now. Been a good ride for first trade here. Thanks..
Great! You are very brave to stay in so long!
Is it time to short some of the bear ETFs?
I must have missed the email about your newsletter on options. Could you please resend?
Do you have the year to date results?
Is it time to short some of the bear ETFs?
When the Inverse Funds meet the Rules (Above the Green Line + Above 90 Relative Strength) we will Buy them.
Currently Inverse Funds like SH (Inverse S&P) are BEAR with only 9 Relative Strength.
SH CHART
We only suggest Selling Covered Call Options because:
Investors that “BUY” options usually lose on about 70% of their trades, because of time decay,
Investors that “SELL” covered call options win about 70% because of time decay.
Selling covered call options on Leaders when they get in the Red
Zone could improve your income from Investments:
http://www.investopedia.com/articles/optioninvestor/08/covered-call.asp
Previous trades are on the web site and on each email under CLOSED POSITIONS.
http://staging.abovethegreenline.com/closed-results/
Hi, am a new subscriber, look forward to receiving your emails. I too trade to help canine rescue organizations.
All the best!!
Welcome Jag!
And thank you for helping animals.
Good trading, and tell your friends!
Greetings!
I am a new subscriber to AGL. My small account do not allow me to trade stocks so I buy Call Options instead. I need some guidance and tips, e.g. ITM/OTM strikes, delta, DTE, etc … Btw, I only take short term AGL signals. Hope there are fellow members trading Call Options and are willing to share.
Thank you.
Cheers!
Hi J. I will add your comment to the Forum for all to see.
Good trading, and tell your friends!
Joined today__ Where can I put in a symbol to find a chart giving the 3 rules Thanks
Welcome.
There is a Link on the web site Main Menu under Chart/ StockCharts or click
HERE
Today some of your buy or sell was based on the pink line. First time I have seen that. Where is it mentioned in the rules? Thanks
Yes PSQ had the Money Wave Close > 20 today, but PSQ is currently Below the Green Line so we can’t Buy it yet, according to the Rules.
So we changed it to Medium Term Buy, and will enter on a Close above the Pink Line.
PSQ Chart
In your current open positions, why would you buy a stock when the stop price is so far away ie USO? Thanks
You would not… USO was bought too high, and then it tanked way below the Stop so we kept it that day … Now just hoping to sell up near the Green Line.
But it might go down once more, so Stop is not tight, yet.
USO Chart
You state inverse funds and commodities could soon enter stage 1. Page 12 covers inverse funds and gold oil are covered. Would you consider adding a page on commodities funds and stocks. Thanks
The Commodity Bull Market attempt died with the recent China Trade War. The Trade war broke the back of Steel Coal Copper, etc..
We will make Page 11 a Commodity /Tangible Investments Page.
Thank you!
Rule #2 says relative strength factor should be over 90— not rsi. What is the difference? I know you look at rsi on ETFs different from stocks. But, GLD has a etf Rel Strength of 20 and the SCTR is 91.5. Too much spread. Please explain. Thanks
RSI is a short term indicator plotted on a vertical scale from 0 to 100. Values above 70 are considered overbought and values below 30, oversold. For only 1 Investment.
Relative Strength Factor is a percentile ranking of the price performance relative to other securities and relative to the broad U.S. market performance.
Relative Strength Values comes from the SCTR Rank (StockCharts Technical Rank), http://www.etfscreen.com for ETFs , and Investor’s Business Daily (IBD) for stocks.
We prefer the longer term weighting used by http://www.etfscreen.com and IBD.
On the bottom left of many Charts are 2 Relative Strength SCTR (StockCharts Tech Rank). the first one is weighted too fast, so we like to use the 155-day avg SCTR value to be up near 90 also.
On the recent GLD rally, the R S for ETFscrren.com is 79, and SCTR 155-day avg is still only 38. (Too early to Buy for both.) It is also better for the Investment to have NO RESISTANCE in the last 52 weeks.
GLD CHART
Why are the charts so small with so many large ads on the pay site? much nicer charts on the free site and no ads?
Please try this LINK
That is what I call the free side with big charts and no ads
Make sure you are logged in at StockCharts…
So, Do I have to join and pay another fee to Stock Charts to see large charts with your 3 rules? Thanks
You should be able to access more Green Line Charts here:
https://stockcharts.com/public/1107832
Please! We keep saying the same without an answer. The free side to the public is great on the stocks they choose. I want the same info on my stocks.without the charts being so small on a page with a lot of ads. Do I have to join StockCharts and pay their fee to get it? Thanks
Yes, you need a StockCharts account to chart your own portfolio.
If you don’t want to pay, maybe try http://www.freestockcharts.com
Hi Joanne. Long time member of stockcharts, about 20 years. Have checked your public page many, many times, and have read it in some detail at different times. Always liked your charts and ideas. I have had my own journey to developing a system, and am happy with it. Finally joined ATGL yesterday. What you give me is a proven system, with satisfied subscribers, clarity and simplicity. From that I get motivation and a structure for discipline. Happy to be a member here, and to share your devotion to the welfare of animals. Thank you for sharing your methods and systems and philosophy. — Joseph, March 1, 2022.
Nice to hear, Joseph.
And Welcome!