Percentage Price Oscillator (PPO) Indicator Overview

[ez-toc] The Percentage Price Oscillator (PPO) offers valuable insights into market trends. By comparing the relationship between short-term and long-term price movements, the PPO helps you identify momentum shifts with greater accuracy. What Is the Percentage Price Oscillator (PPO)? The PPO is a momentum-based technical indicator that measures the difference between two moving averages of […]
Parabolic SAR Indicator: Overview, Formula, and Trading Strategies
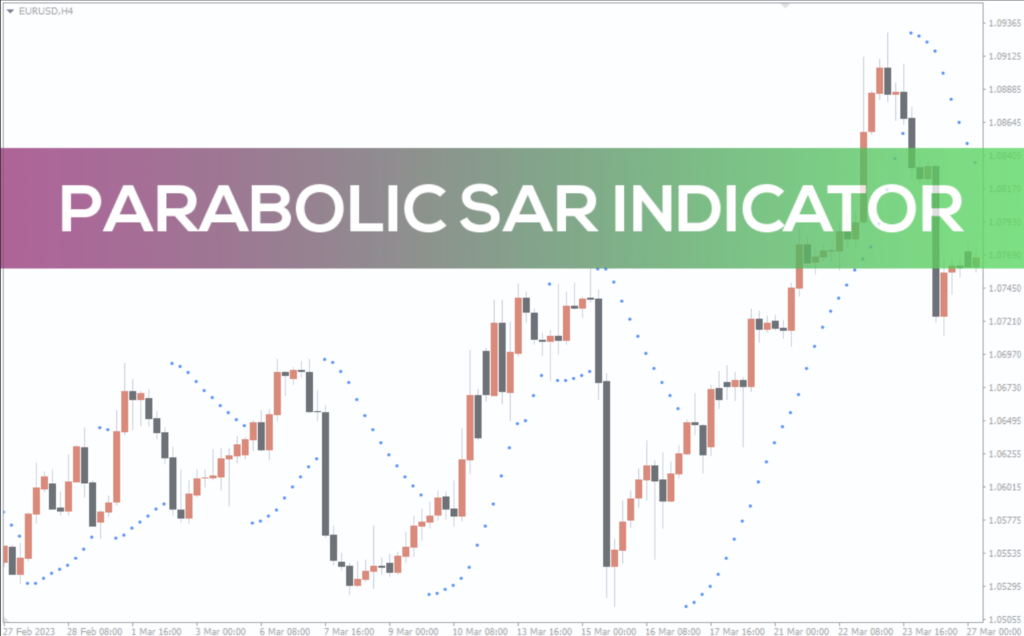
[ez-toc] Traders seeking to refine their market timing and risk management often turn to the Parabolic Stop and Reverse (SAR) indicator. This versatile tool, appearing as a series of dots on price charts, offers clear signals for potential trend reversals and momentum shifts. Whether you’re new to technical analysis or looking to improve your existing […]
What Investors Should Know About Trade Desk Stock Forecast
[ez-toc] As an investor looking into Trade Desk Inc. (TTD), you can’t make an informed decision without first understanding its stock forecast. This article provides you with a comprehensive overview of Trade Desk’s potential, covering financial performance, analyst ratings, market trends, and strategic company moves. Trade Desk Inc. (TTD) Company Overview Trade Desk Inc. operates […]
The Ultimate List of Technical Indicators for Trading
[ez-toc] As an investor or trader, having a toolkit of technical indicators can significantly improve your market analysis and decision-making process. This comprehensive guide will explore a list of technical indicators that can help you navigate trading with greater confidence and precision. 1. Stochastic Oscillator The Stochastic Oscillator is a momentum indicator that compares a […]
A Guide on How To Trade the Bear Pennant Pattern
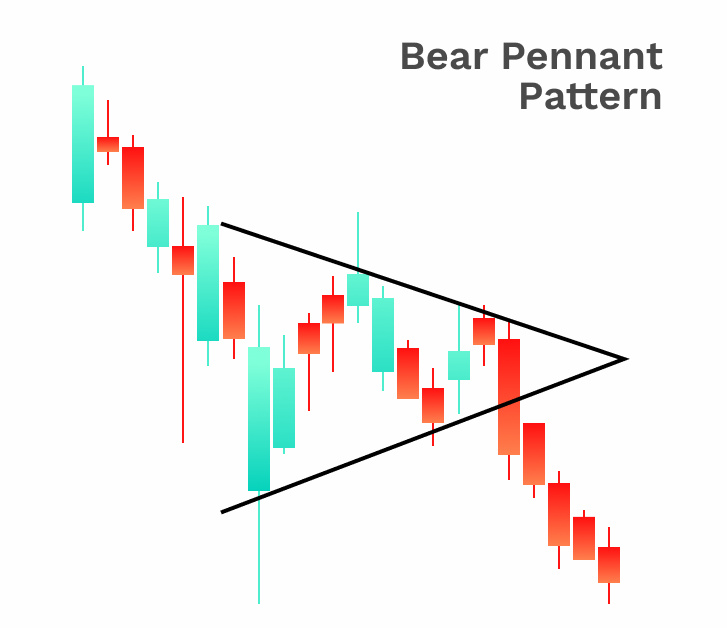
[ez-toc] The bear pennant pattern is a valuable tool in technical analysis, offering insights into potential downward price movements in financial markets. This guide explores the bear pennant, its identification, trading strategies, and its strengths and limitations. What Is a Bear Pennant and What Does It Look Like? A bear pennant is a continuation pattern […]