Mastering Options: 10 Strategies Every Trader Must Understand
[ez-toc] In the fast-paced world of trading, options are often viewed as a mystical tool that can deliver both immense benefits and significant risks. Understanding how to navigate this complex financial instrument is essential for both novice and experienced traders. Options trading offers a variety of strategies that can cater to different market conditions and […]
Mastering Swing Trading: Essential Order Types You Need to Know
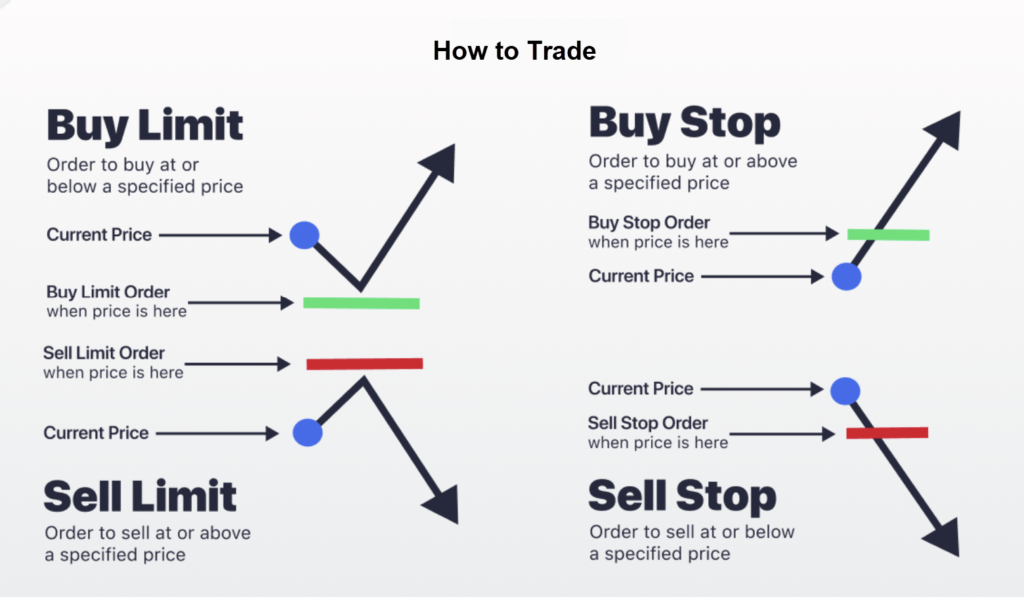
[ez-toc] Swing trading offers a unique approach to capitalizing on market fluctuations, appealing to both novice and experienced traders alike. This strategy focuses on holding positions for several days to capture short-term price movements, making it essential to understand various trading mechanisms. Grasping the different order types can significantly impact your success and risk exposure […]
Stochastic Oscillator Indicator: Calculations and How It Works
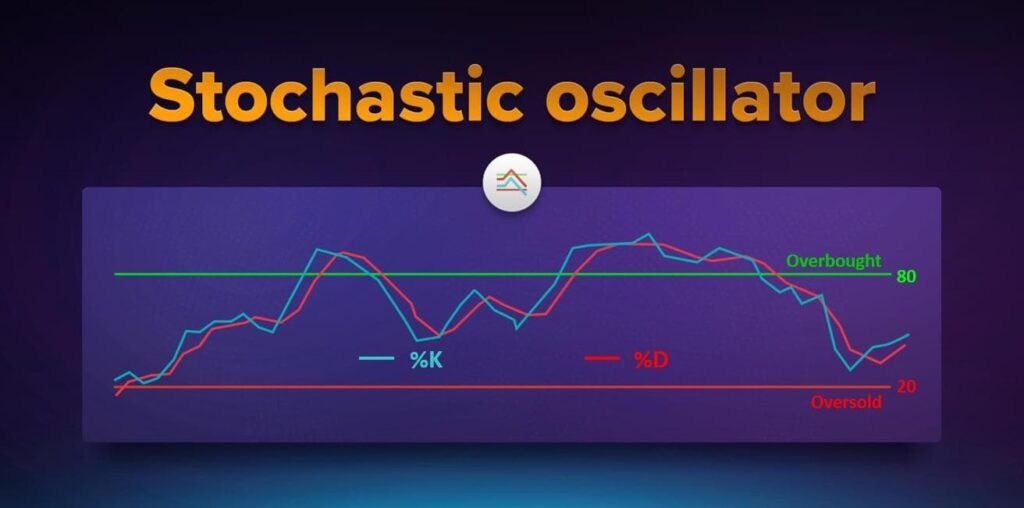
[ez-toc] Traders rely on the stochastic oscillator in technical analysis to identify potential buy and sell signals. This momentum indicator compares an asset’s closing price to its recent price range to determine whether the asset is overbought or oversold. Understanding the calculation and interpretation of the stochastic oscillator can significantly enhance your trading strategies and […]
Parabolic SAR Indicator: Overview, Formula, and Trading Strategies
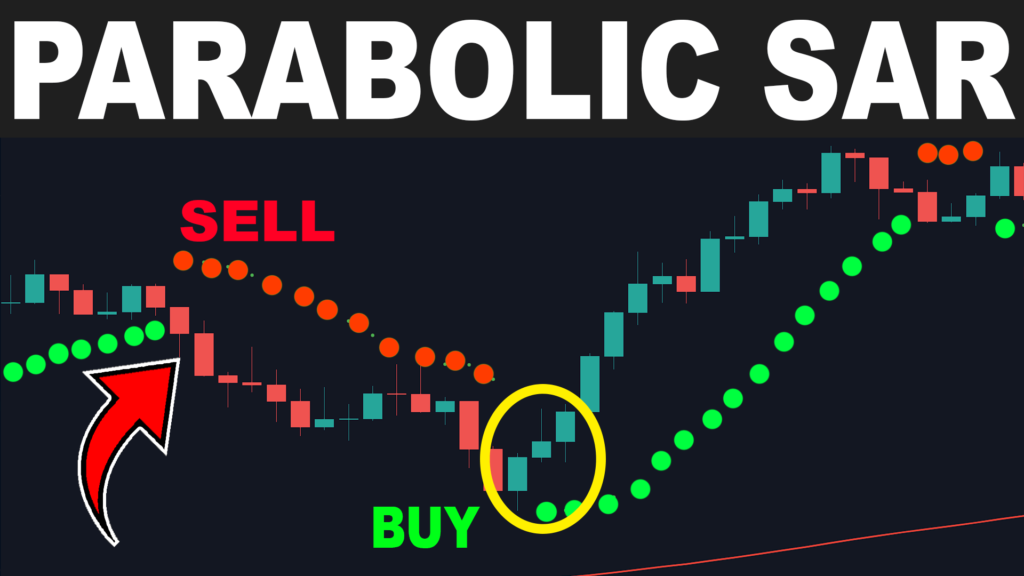
[ez-toc] Traders seeking to refine their market timing and risk management often turn to the Parabolic Stop and Reverse (SAR) indicator. This versatile tool, appearing as a series of dots on price charts, offers clear signals for potential trend reversals and momentum shifts. Whether you’re new to technical analysis or looking to improve your existing […]
Aroon Oscillator: Definition, Formula, Calculation, and Uses
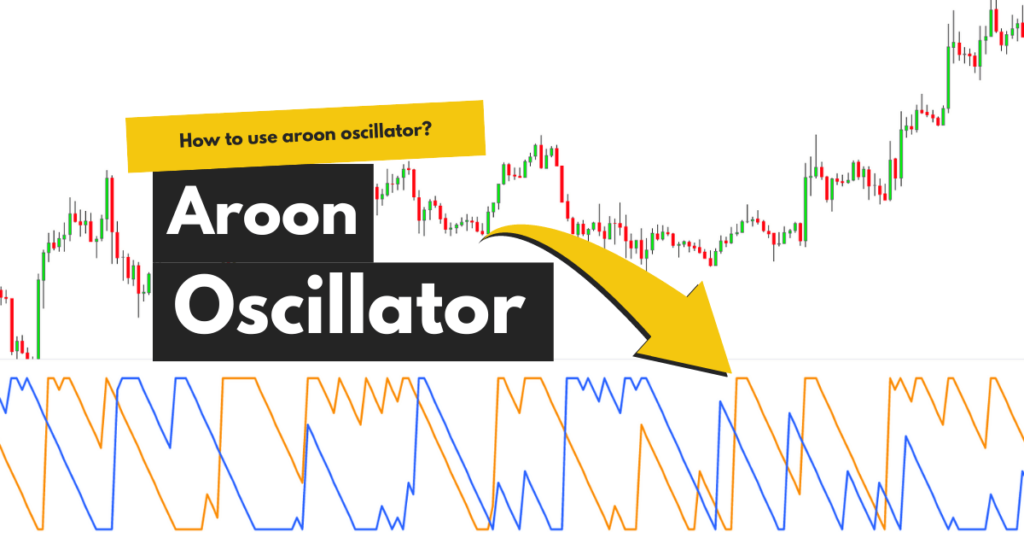
[ez-toc] The Aroon Oscillator is a valuable technical indicator that measures the strength and direction of a market trend. Developed in 1995 by Tushar Chande — a well-known quantitative analyst, trader, and author — the Aroon Oscillator is widely used by traders as a way to identify emerging trends and potential reversals. This article provides […]