Bear Flag Pattern: Definition, Overview, and Trading Strategies
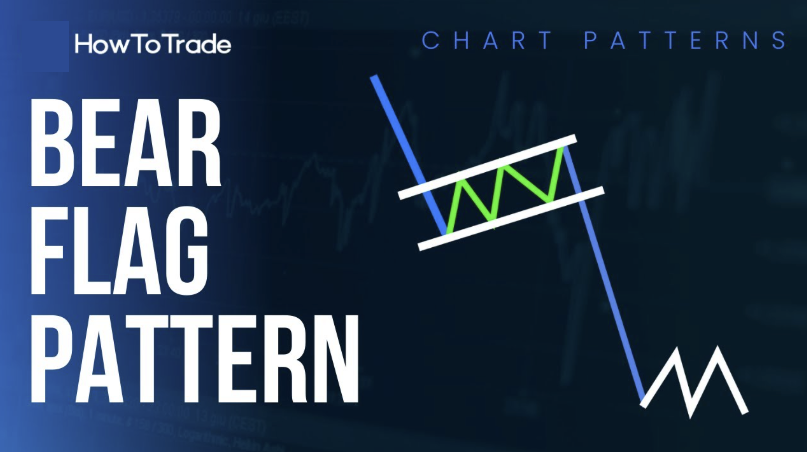
[ez-toc] The bear flag pattern is a technical continuation pattern that signals the potential for an ongoing downtrend after a brief consolidation period. It is a critical formation in bearish markets, offering you strategic entry points for short positions. When properly identified and traded, the bear flag can provide a strong risk-reward setup with defined […]
How To Identify and Trade the Cup and Handle Pattern

[ez-toc] The cup and handle pattern is a well-known technical analysis formation that signals a potential bullish continuation in stocks and other tradable assets. By understanding how to identify and trade this pattern effectively, you can take advantage of potential breakouts and optimize your investment strategies. What Is a Cup and Handle Pattern? A cup […]
Understanding How To Trade the Head and Shoulders Chart Pattern

[ez-toc] The head and shoulders pattern stands as one of technical analysis’s most recognized and significant chart formations. This price action pattern signals a potential trend reversal, marking a transition from bullish to bearish market conditions when it appears in an uptrend. For traders focused on stock forecasting, understanding this pattern provides valuable insights into […]
How To Recognize and Trade the Rising Wedge Pattern
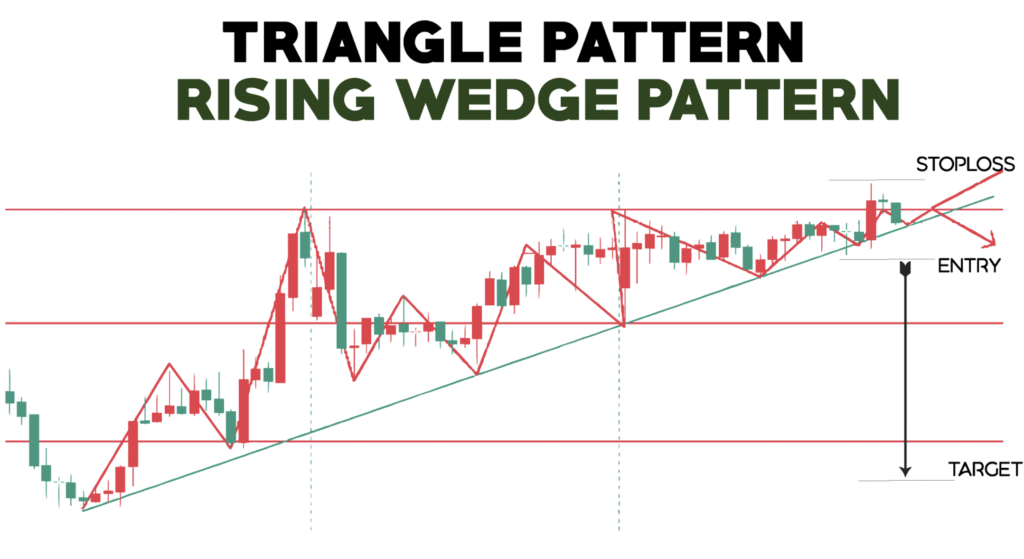
[ez-toc] The rising wedge stock pattern represents a significant technical formation in financial markets, characterized by converging trendlines that slope upward as price action narrows. This pattern typically indicates exhaustion in an upward trend, making it valuable for traders seeking optimal exit points or potential shorting opportunities. What Is a Rising Wedge Pattern and Why […]
The Bull Flag Chart Pattern Explained
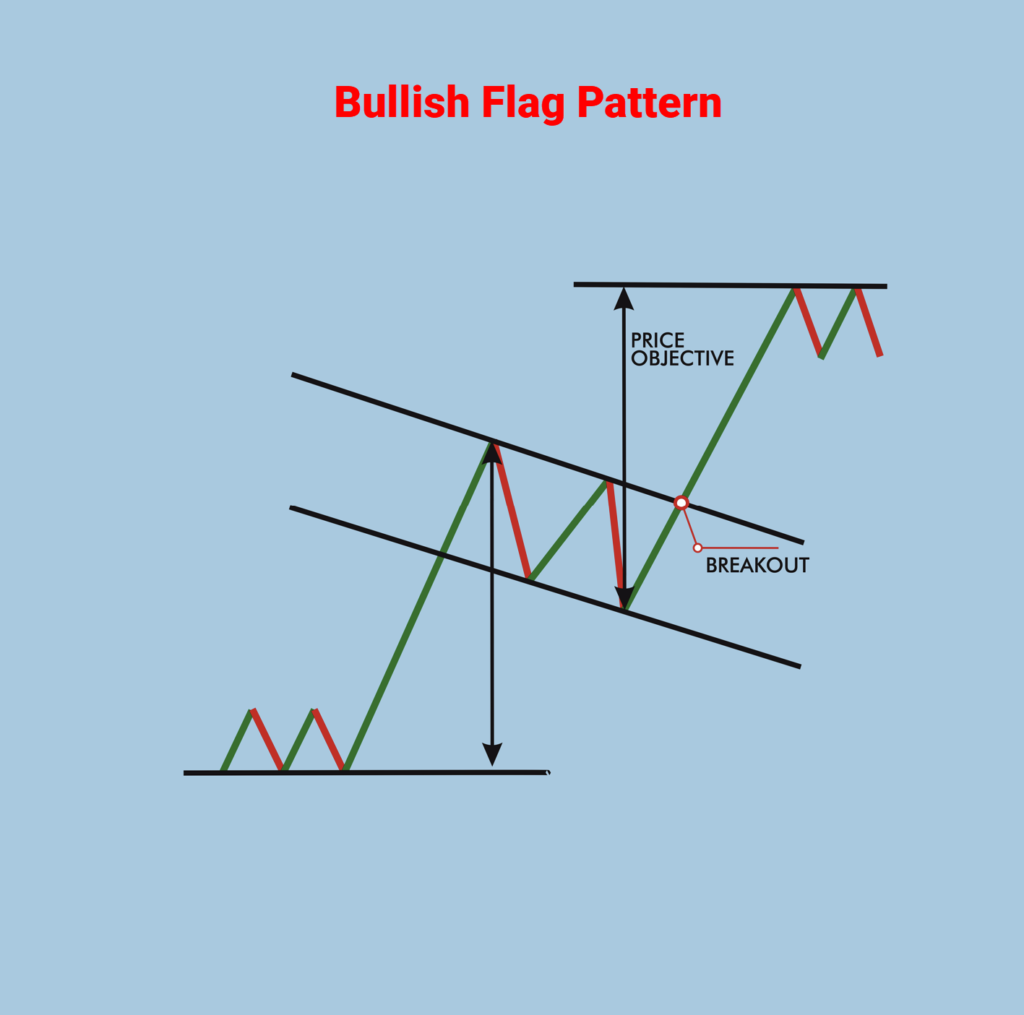
[ez-toc] A bull flag is a continuation pattern that forms in the middle of an established bullish trend. It signals a temporary pause or consolidation period before the price resumes its upward trajectory. The pattern gets its name from its resemblance to a flag on a pole, where the “flagpole” is the sharp initial rally, […]