Double Top Pattern: How to Identify and Trade This Reversal Signal
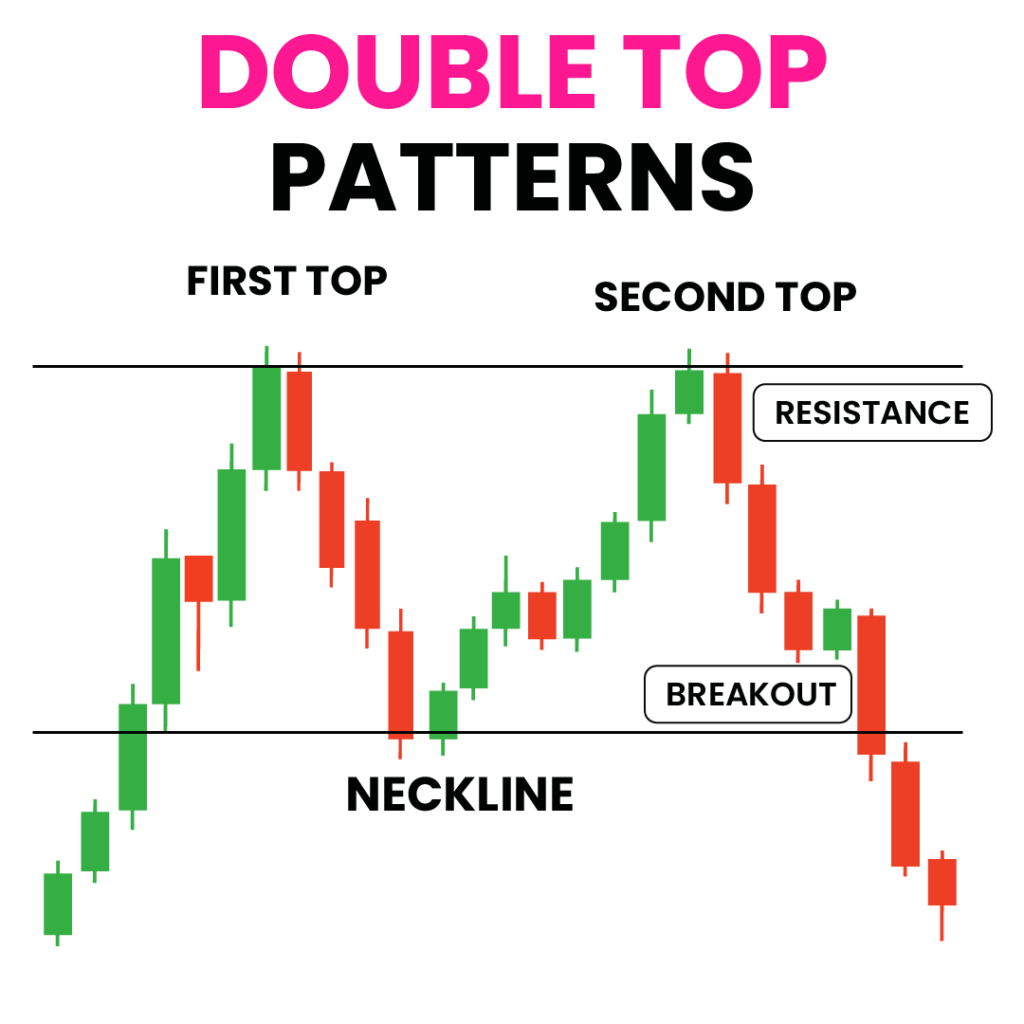
[ez-toc] The double top pattern ranks as one of the trading patterns you should know when conducting technical analysis. This formation appears frequently across various timeframes and markets, serving as a powerful bearish reversal signal that experienced traders monitor closely. Understanding this pattern provides valuable insight into potential market direction shifts and offers strategic trading […]
What Is the Triple Bottom Pattern and How to Trade This Bullish Reversal?
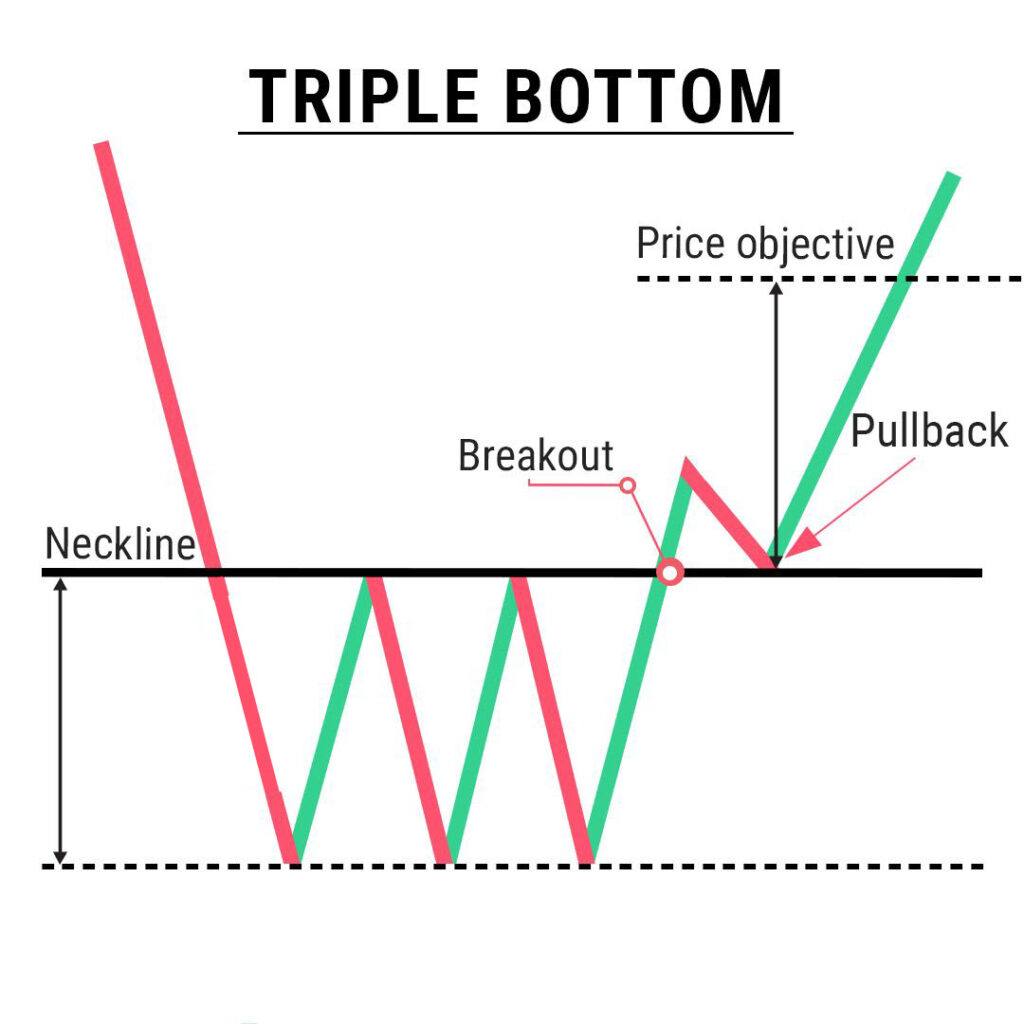
[ez-toc] Technical analysis provides you with powerful tools to identify potential market movements through pattern recognition. Among these valuable trading patterns you should know, the triple bottom pattern stands out as a significant bullish reversal pattern. This pattern appears after a prolonged downtrend and signals a potential shift in market sentiment. Understanding how to identify […]
What’s the Average Return in the Stock Market?

[ez-toc] Investing in the stock market often raises the question: what is the average return one can expect? For most investors, understanding stock market dynamics is crucial, as it helps set realistic expectations for financial growth. This article tackles these crucial topics by exploring historical data and the typical benchmarks used to measure stock returns. […]
Triple Top Pattern: What It Is, How It Works, and Examples

[ez-toc] The triple top pattern is one of the most reliable bearish reversal patterns in technical analysis. When properly identified, this formation can give you valuable insight into potential market direction changes and profitable trading opportunities. What Is a Triple Top Pattern? A triple top pattern is a technical chart formation that indicates a […]
A Guide to the Triangle Chart Pattern in Technical Analysis

[ez-toc] Triangle chart patterns represent distinct formations in price charts that technical analysts monitor to aid in making investment decisions. These patterns emerge through the compression of price movements, forming triangular shapes on charts. By analyzing these patterns, you can anticipate potential price movements and develop appropriate trading strategies. Understanding Triangle Chart Patterns Triangle patterns […]