Bullish Pennant Pattern: How to Trade This Powerful Continuation Signal
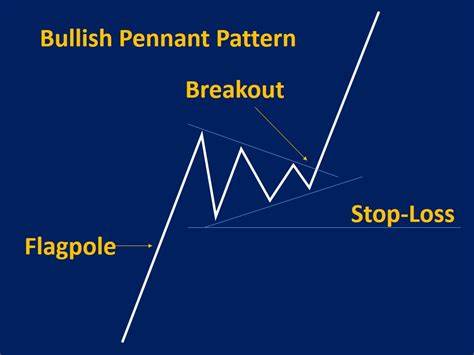
[ez-toc] The bullish pennant pattern ranks among the most reliable continuation patterns in technical analysis. This pattern signals a temporary pause in an uptrend before prices continue their upward trajectory. For traders using chart patterns to inform their investment decisions, recognizing and accurately interpreting the bullish pennant offers substantial profit opportunities. This article examines the […]
Rounded Top Pattern: How to Spot and Trade This Bearish Reversal
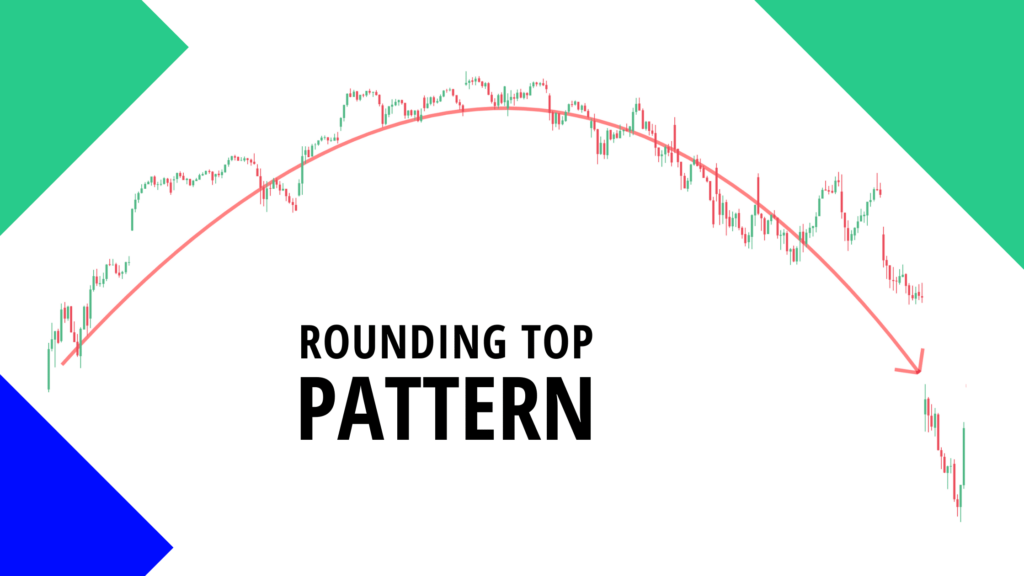
[ez-toc] Recognizing trend reversals is critical to preserving profits and optimizing the timing of your trades. One powerful bearish reversal formation is the rounded top pattern. When spotted and traded correctly, it can offer an early warning that an uptrend is losing steam, providing an opportunity to reposition or protect your investments. This article will […]
Relative Strength Index (RSI): How to Spot Overbought and Oversold Markets
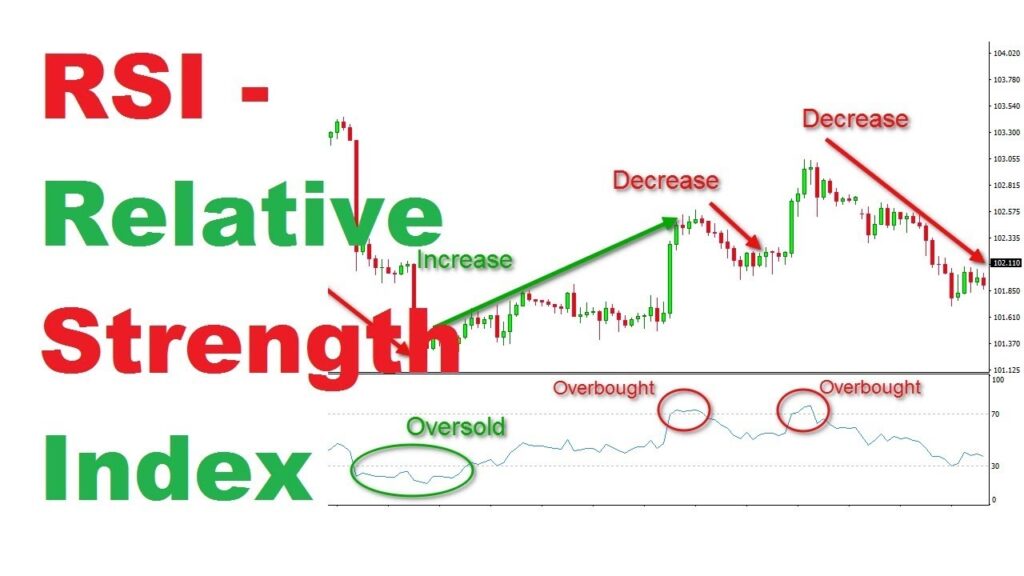
[ez-toc] In the exhilarating world of trading, finding the right tools to make informed decisions can feel like searching for a needle in a haystack. Among these tools, the Relative Strength Index (RSI) emerges as a beacon for traders aiming to decipher market trends and forecast potential reversals. Developed by J. Welles Wilder Jr., the […]
OBV Indicator (On-Balance Volume): How to Use Volume to Confirm Price Trends

[ez-toc] In the fast-paced world of financial trading, indicators that offer clarity and confirmation of market trends are invaluable. The On-Balance Volume (OBV) indicator emerges as a crucial tool for traders, helping to decipher the underlying market sentiment by leveraging volume data. Developed by Joe Granville in the 1960s, OBV combines price and volume in […]
Trading Divergences: How to Spot Reversals Using RSI and MACD
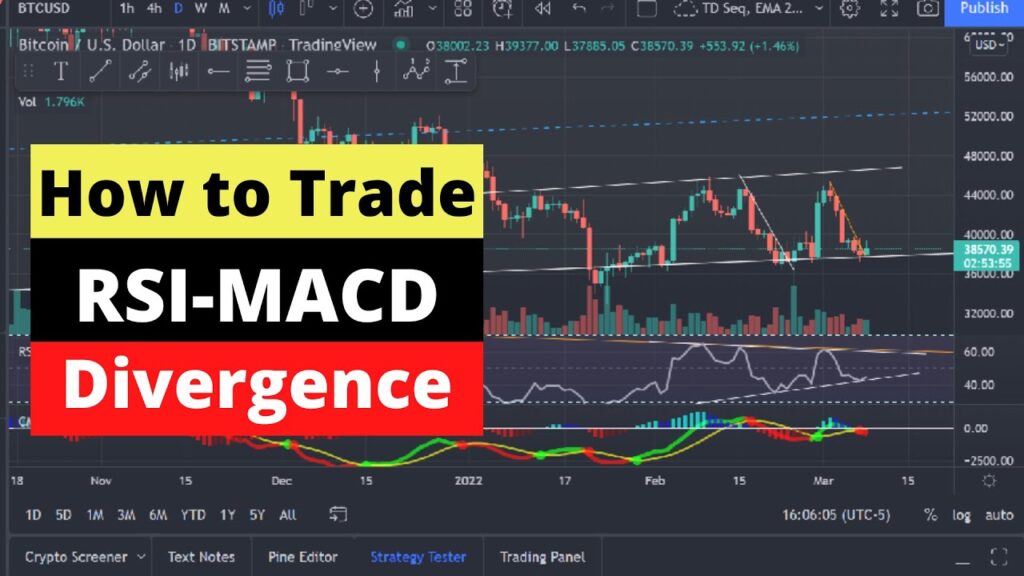
[ez-toc] Why Divergence Matters in Technical Trading Spotting trend reversals before they happen is one of the most valuable skills a trader can develop. Divergence trading is one such method—where the behavior of price diverges from an indicator like the Relative Strength Index (RSI) or Moving Average Convergence Divergence (MACD). These divergences can signal a […]