Good Faith Violations: What Are Unsettled Funds?

[ez-toc] Understanding good faith violations and the concept of unsettled funds is crucial, as these can impact an investor’s ability to trade and result in significant penalties. Unsettled funds refer to the money from a sale transaction that has not yet completed the settlement process. Good faith violations occur when a trader purchases securities using […]
6 Day Trading Patterns You Should Know
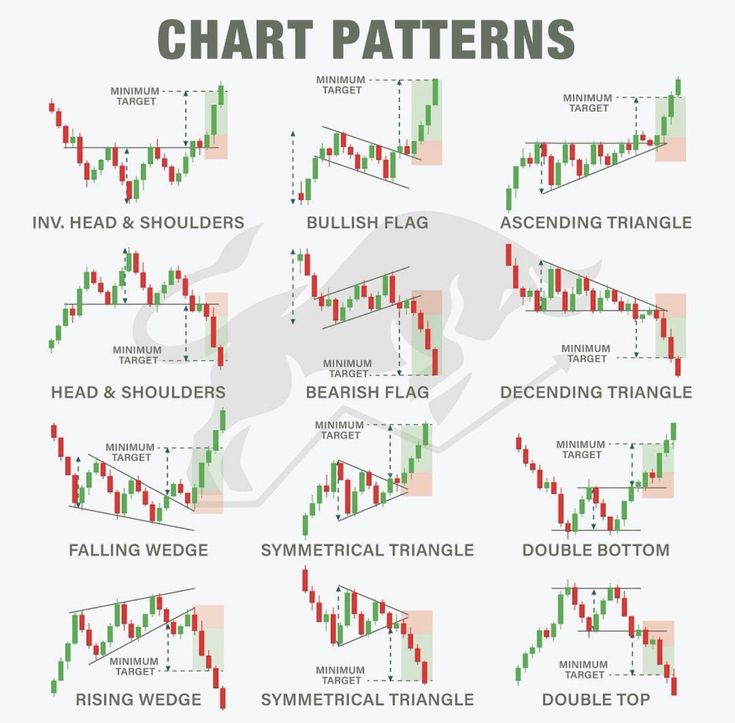
[ez-toc] Day trading involves buying and selling securities within a single trading day and can be a highly profitable trade strategy if executed with precision and foresight. Recognizing reliable day trading patterns is critical, as they are backed by historical data and technical analysis and offer a framework for identifying potential entry and exit points. […]
Are Commodity ETFs a Good Investment?

[ez-toc] Commodity exchange-traded funds (ETFs) are popular for diversifying portfolios beyond traditional stocks and bonds. These ETFs offer unique investment opportunities for physical goods such as gold, oil, and agricultural products without directly purchasing and storing the commodities. Investing in commodity ETFs serves as a hedge against inflation and currency devaluation, as commodities often move […]
6 Commodity Trading Risk Management Strategies

[ez-toc] In the volatile world of commodity trading, effective risk management is crucial for protecting investments and maximizing returns. Commodity trading risk management involves a set of strategic measures designed to mitigate the impacts of market uncertainty, price volatility, and other financial risks associated with trading raw and primary products. By adopting sound risk management […]
How To Build an ICT Trading Strategy

[ez-toc] In the fast-paced world of Forex trading, strategy is king. The ICT (Inner Circle Trader) methodology stands tall, whispered reverently across online trading forums and chat rooms. Understanding how to harness the principles of ICT could be your turning point in mastering the complexities of the market. From the diverse lexicon of trading tactics, […]