Day Trading Taxes: Rates and Tips To Pay Less

[ez-toc] Day trading offers opportunities for profit, but it also comes with complex tax obligations. Figuring out how these taxes work and how to minimize them can help you maximize your earnings. In this article, we’ll cover the tax rates applied to day trading income, key strategies for reducing your tax liability, and answers to […]
Capital Gains vs. Dividends: What Is the Better Option?

[ez-toc] When structuring your portfolios, you face a pivotal choice — focusing on capital gains or dividends. This is often framed as dividends versus capital gains, and it significantly impacts investment strategies and potential returns. Understanding the nuances between these two forms of investment income is vital for optimizing your financial approach and tax efficiency. […]
Explore how the DJIA guides various investment strategies.
[ez-toc] The Dow Jones Industrial Average (DJIA) serves as a powerful tool for guiding various investment strategies, offering investors insights into the performance of some of the largest and most stable companies in the U.S. economy. As a benchmark index that tracks 30 blue-chip stocks across multiple sectors, the DJIA provides a snapshot of overall […]
What Is the Triple Exponential Moving Average (TEMA)?
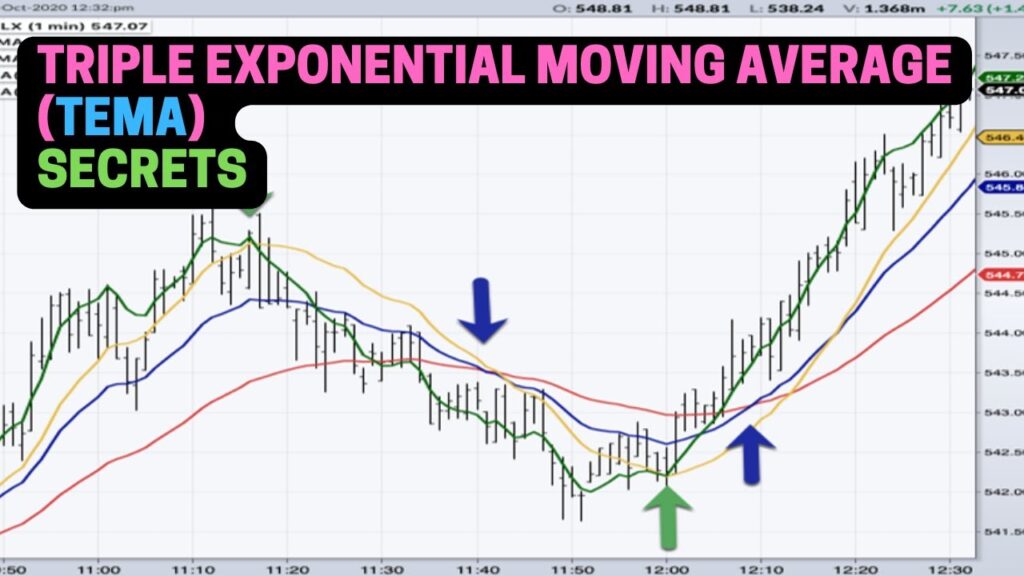
[ez-toc] The Triple Exponential Moving Average (TEMA) is an advanced technical indicator used by traders and analysts to identify trends and potential reversal points in financial markets. Developed by Patrick Mulloy in 1994, TEMA reduces lag in traditional moving averages while maintaining sensitivity to price changes. This tool combines multiple exponential moving averages (EMAs) to […]
Double Exponential Moving Average (DEMA) Explained
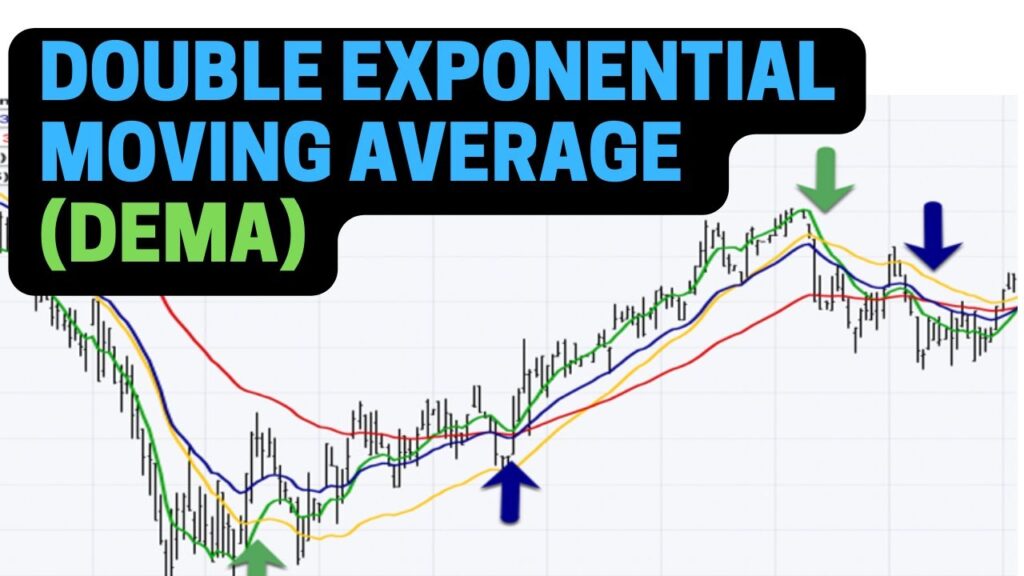
[ez-toc] In technical analysis, traders constantly seek tools to assist their decision-making processes. The Double Exponential Moving Average (DEMA) stands out as a powerful indicator that addresses some limitations of traditional moving averages. This article details the intricacies of DEMA, exploring its formula, calculations, and applications in trading strategies. What Is DEMA? The Double Exponential […]