What Is an Asset Bubble? Causes, Examples, and Protection
[ez-toc] An asset bubble occurs when the price of an asset, such as stocks, real estate, or commodities, rises dramatically above its fundamental value. During these periods, market participants drive prices to unsustainable levels through excessive speculation and unrealistic expectations of future returns. These dramatic price increases typically stem from a combination of psychological factors, […]
Mean Reversion Explained: A Comprehensive Overview for Investors
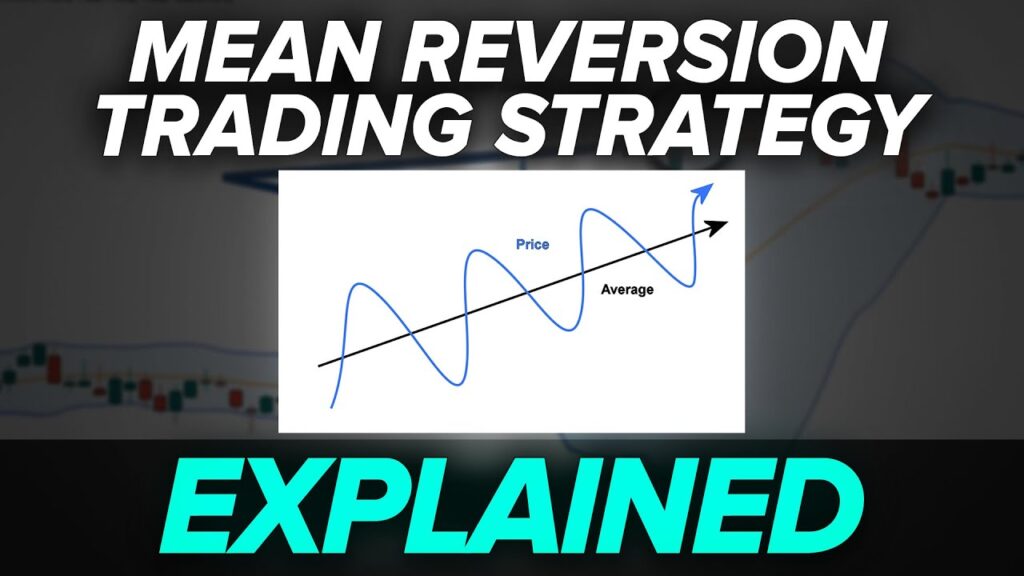
[ez-toc] Investors often grapple with market unpredictability, continually seeking strategies to gain an edge. One such intriguing concept is mean reversion, an idea that encourages looking for patterns and returns to average values over time. Understanding mean reversion can unveil essential insights into market behavior and enhance investment strategies. At its core, mean reversion posits […]
What Is Copy Trading? Strategies, Pros and Cons

[ez-toc] Imagine a world where you can invest in the stock market without spending hours analyzing charts and market trends—this is the allure of copy trading. As a revolutionary approach in the trading sphere, copy trading allows individuals to mimic the trades of experienced investors, potentially reaping the benefits without the steep learning curve. The […]
Scalping vs. Swing Trading: What Is the Difference?
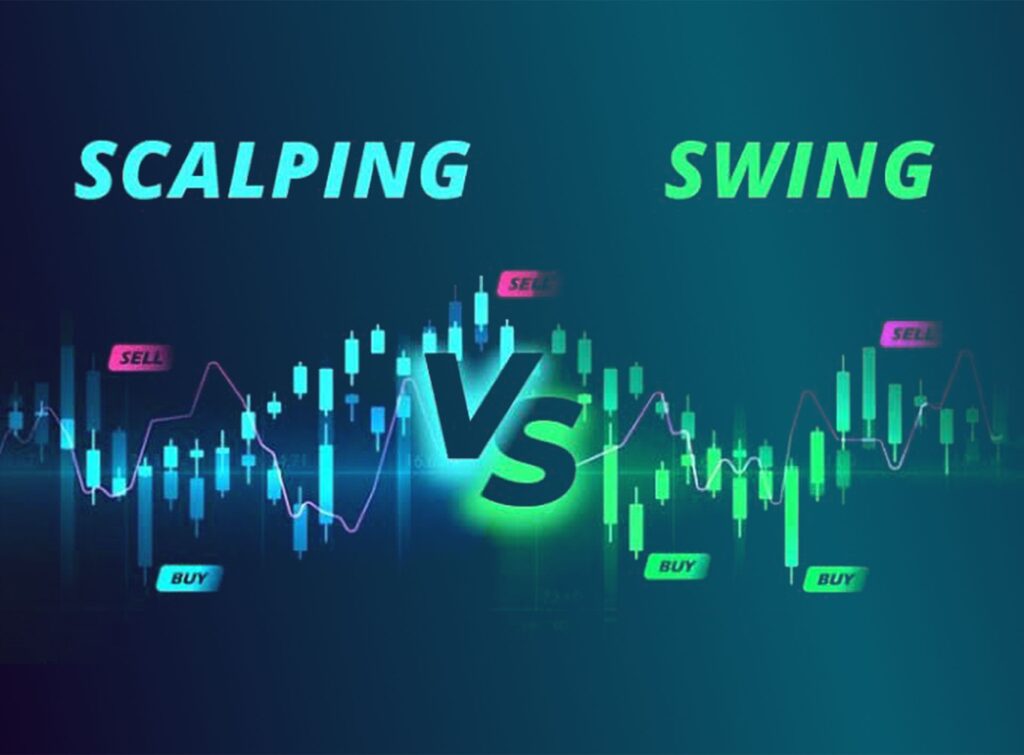
[ez-toc] At the intersection of speed and patience in financial markets lie two prominent trading strategies: scalping, with its lightning-fast executions, and swing trading, with its more deliberate approach. While both aim to profit from market fluctuations, they differ significantly in their execution and underlying principles. This article looks into the key differences between scalping […]
What Is Weighted Moving Average Forecasting?
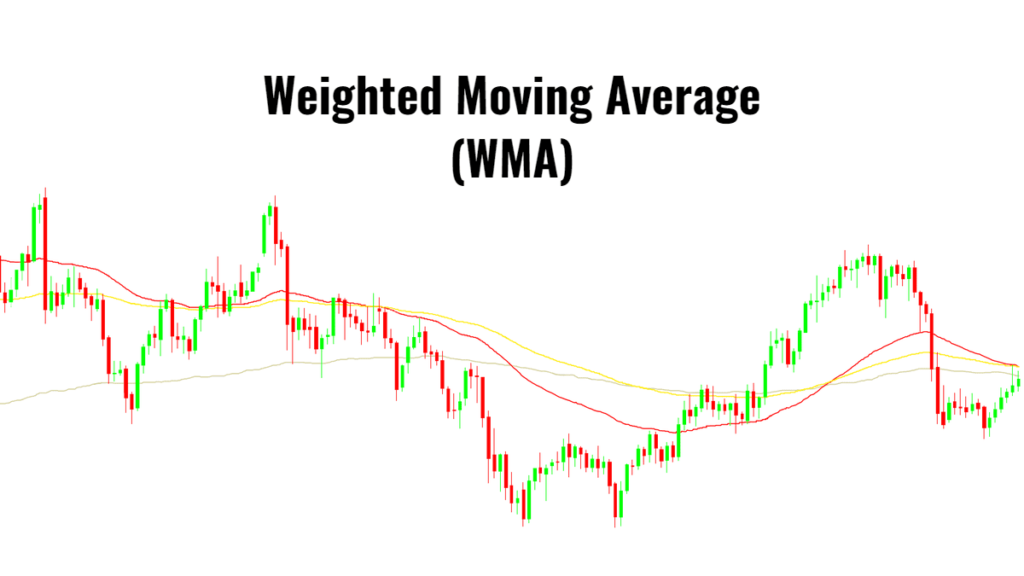
[ez-toc] Weighted Moving Average (WMA) forecasting is a sophisticated technique used by traders and investors to analyze and predict price trends. By assigning greater significance to more recent data points, WMA offers a nuanced perspective on market movements, allowing for more responsive and accurate forecasting. This method is valuable for identifying short-term trends and making […]