How To Calculate Return on Assets (ROA): Formula and Calculation Examples

[ez-toc] Return on Assets (ROA) is a financial metric that provides valuable insight into operational efficiency and management effectiveness. By understanding the nuances of this formula and how it applies across industries, you can make smarter investment decisions and identify high-performing companies. This article will break down the ROA formula, explain its components, and share […]
What Are Profitability Ratios? | Types and Formulas
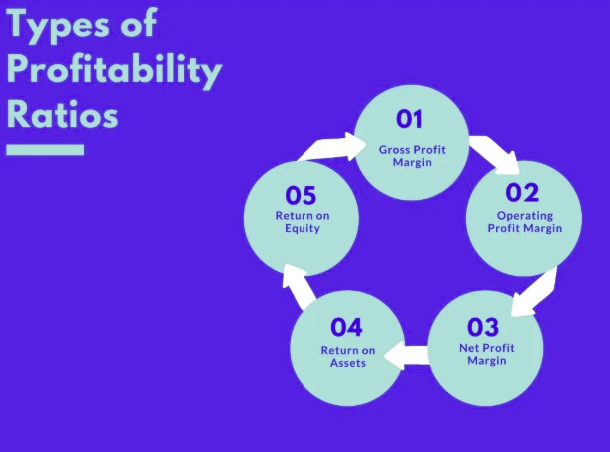
[ez-toc] Profitability ratios evaluate a company’s ability to generate profit relative to its revenue, balance sheet assets, or equity. These financial ratios provide insights into operational efficiency, financial performance, and overall business health. They are important for investors and analysts conducting financial analysis to identify opportunities or assess risks. This article covers the common […]
Understanding Investment Turnover Ratio in Swing Trading

[ez-toc] Understanding Investment Turnover Ratio in Swing Trading The turnover ratio is a critical yet often overlooked metric when evaluating investment strategies, especially swing trading. Defined as the measure of how frequently assets in a portfolio are traded, the turnover ratio is particularly relevant to swing traders due to the active nature of their approach. […]
How to Evaluate an Investment Strategy Like Swing Trading?

[ez-toc] Investors have a plethora of strategies to choose from when navigating the financial markets. Swing trading, characterized by its short- to medium-term approach, is one such strategy aimed at capturing price movements over several days or weeks. But how does one evaluate whether swing trading is a viable and superior option compared to traditional […]
Backtesting: Definition and How a Trading Strategy Backtest Works

[ez-toc] For traders seeking to validate their market strategies, historical performance data provides the most reliable indicator of future success. Backtesting simulates how trading strategies would have performed using historical market data. This quantitative method lets you evaluate your strategies’ effectiveness before risking real capital. You can use backtesting to measure potential returns, analyze risks, […]