How the Federal Reserve Impacts the Stock Market

How the Federal Reserve Impacts the Stock Market The Federal Reserve System is the central banking system of the United States that is responsible for encouraging healthy operations within the economy as well as reflecting public interest. It advertises five primary duties that help maintain and grow the U.S. economy. To begin, the Fed conducts […]
Multiple Time Frame Strategy
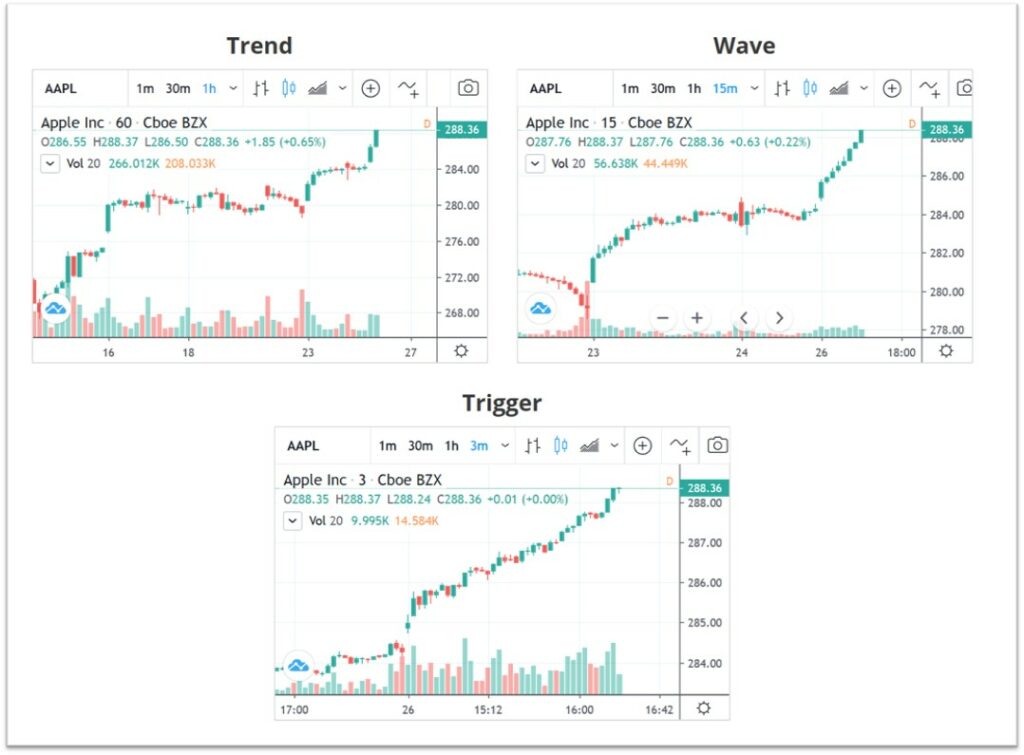
Multiple Time Frame Strategy [ez-toc] What is Multiple Time Frame Analysis? The multiple time frame investment strategy can best be defined as an approach that examines securities at different intervals of time. A security is any financial instrument that holds monetary value. It can be a stock, bond, currency pair, etc. When using multiple time […]
Buy and Hold vs. Market Timing

Buy and Hold Investing or Market Timing? [ez-toc] There is often debate between investors as to which investment method is better: a traditional buy-and-hold approach or market timing. Here, we will discuss the merits and challenges that both strategies present to hopefully give a better understanding of which method works best for you. Market Timing […]
Risk/Reward Ratio
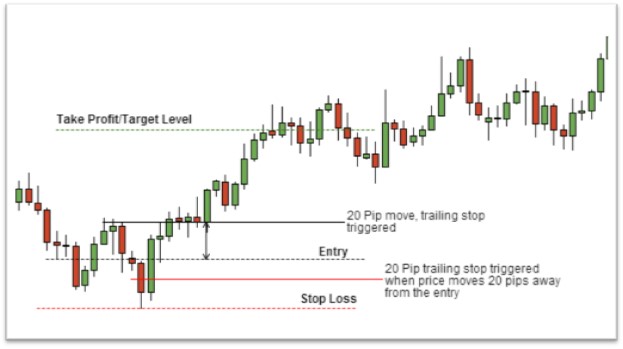
How to use Risk/Reward Ratio when Investing [ez-toc] What is the Risk/Reward Ratio? Investing in the market, especially individually, comes with a lot of risks that one should attempt to protect themselves from. A great way to safeguard your investment is to use a risk/reward ratio. The risk/reward ratio is a method used by […]
Fundamental Analysis vs. Technical Analysis

Fundamental Analysis vs. Technical Analysis [ez-toc] When it comes to investing your money, it is important to have a grasp of the basic schools of thought: fundamental analysis and technical analysis. Both approaches differ greatly from one another, yet both are immensely useful depending on your interests and goals. Fundamental Analysis Fundamental analysis is […]