Effects of a Weakening U.S. Dollar

Effects of a Weakening U.S. Dollar [ez-toc] What Does a Weak U.S. Dollar Mean? Recently, media outlets have been buzzing about the weakening of the U.S. dollar, but what does that really mean? The term “weak dollar” signifies that, in relation to other currencies, the U.S. dollar is trending downwards. In other words, a weak […]
Dogs of the Dow Portfolio
Dogs of the Dow Portfolio Dogs of the Dow is a stock-picking strategy that aims to beat the Dow Jones Industrial Average (DJIA) each year by selecting the highest dividend DOW stocks. The strategy produces a portfolio resulting in an equal amount of money being invested in the 10 highest dividend-yielding, blue-chip stocks among the […]
Short Selling

Short Selling [ez-toc] What is Short Selling? Short selling is somewhat of an untraditional method of investing that allows investors to profit from securities when they decrease in value. This method of investing is considered quite advanced and should only be undertaken by experienced traders and investors. To short sell, an investor or trader borrows […]
How to Profit from Stock Market Sector Rotation
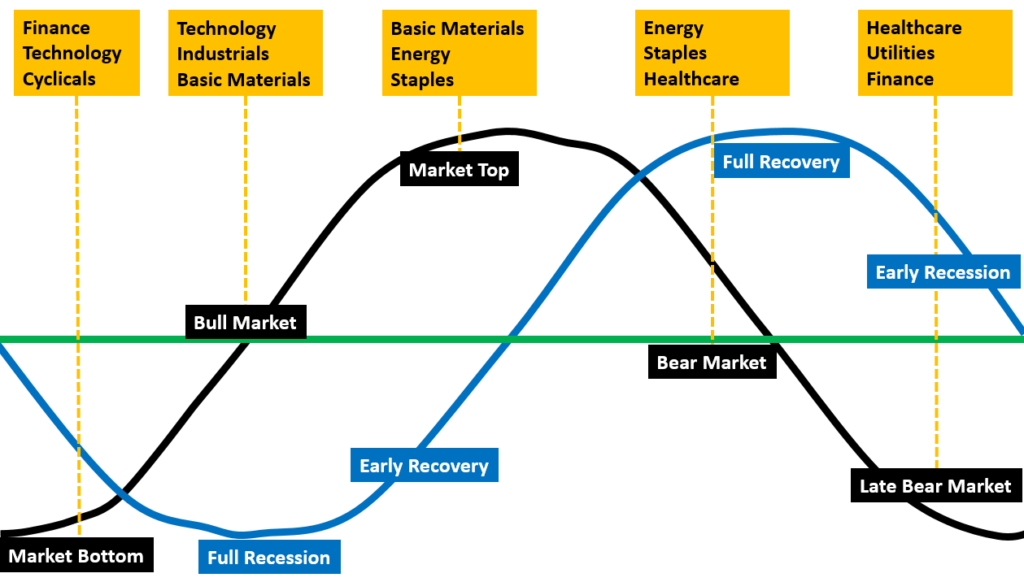
How to Profit from Stock Market Sector Rotation [ez-toc] What is Sector Rotation? Sector rotation is the movement of money that has been invested in stocks from one industry to another. In other words, traders and investors move their invested money from one industry to another as they attempt to predict the coming stages of […]
Is Swing Trading The Best Strategy For You?

Is Swing Trading The Best Strategy For You? What Is Swing Trading? Swing trading is a trading style that broadly describes a plethora of short term trading strategies that are ultimately designed to capture gains from a financial instrument. Most commonly exemplified with stocks, swing trading involves purchasing a security and holding onto it for […]