
Before diving into specific techniques, it’s important to first explore the tools needed for drawing stock charts. Although various charting platforms provide automated tools for drawing, there are several traditional tools and modern charting techniques that you can use:
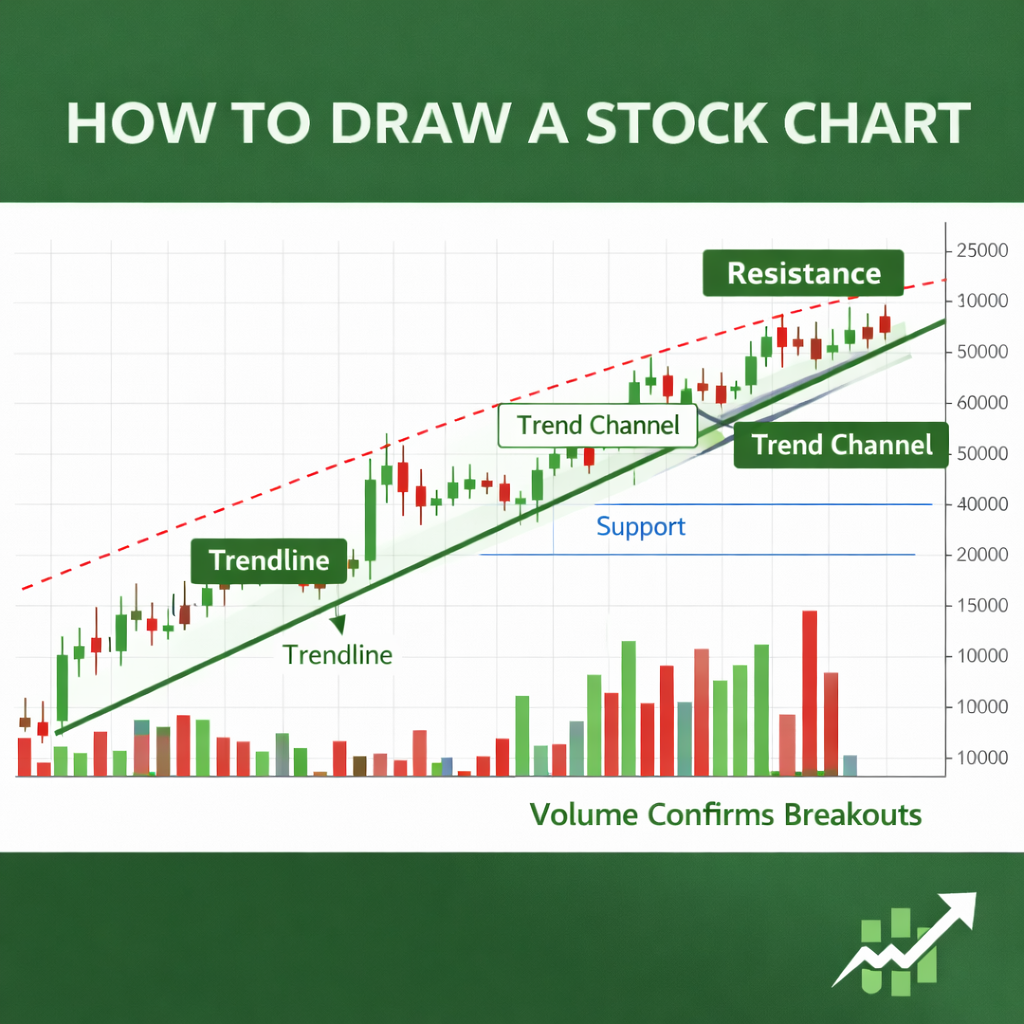
Trendlines are straight lines drawn on a chart to connect significant price points, such as highs or lows, which help define the direction of a market. They are often used to identify the prevailing direction of a price movement—whether it’s upward (bullish), downward (bearish), or sideways (neutral).
Trendlines are straight lines drawn on a chart to connect significant price points, such as highs or lows, which help define the direction of a market. They are often used to identify the prevailing direction of a price movement—whether it’s upward (bullish), downward (bearish), or sideways (neutral).
To draw trendlines, follow these steps:
A trend channel is formed by drawing parallel lines around the primary trendline. These lines, known as parallel support and resistance, can help traders visualize the price range within which the asset is expected to trade. If the price breaks above or below the channel, it could signal a potential breakout or breakdown.
Trend channels help traders gauge the strength of the trend and set potential entry or exit points based on the price movements within the channel.
Support and resistance lines are key price levels that help define the price range within which an asset trades.
To draw these lines:
Identify the Relevant Price Points: Look at past price history for areas where the stock has repeatedly reversed direction. For support, identify the lowest price points reached before the stock bounced upward. For resistance, identify the highest points where the price has reversed downward.
Connect the Points: Once you’ve identified multiple points where the price has either bounced upward (support) or reversed downward (resistance), draw a horizontal line through those points.
Validate the Levels: Strong support and resistance levels should be tested multiple times by the price without breaking. If the price breaks through support or resistance, that level may become a new resistance or support, respectively.
When the price breaks above a resistance level or below a support level, it can signal the start of a new trend. Traders often use these breakouts as signals to enter trades, especially if the breakout is confirmed with high volume.
Chart patterns are formations that appear on stock charts, providing clues about future price movements. These patterns are often used to predict the likelihood of a trend continuation or reversal.
The Head and Shoulders pattern is a reliable reversal pattern that signals a change in trend direction.
Head and Shoulders Top: This pattern signals a reversal from an uptrend to a downtrend. It consists of three peaks: a higher peak (head) between two lower peaks (shoulders). The neckline is drawn by connecting the lows of the pattern, and a breakout below the neckline signals a trend reversal.
Head and Shoulders Bottom (Inverse): This is the reverse of the Head and Shoulders Top and signals a reversal from a downtrend to an uptrend. It consists of three troughs: a deeper trough (head) between two shallower troughs (shoulders). A breakout above the neckline signals a bullish reversal.
Triangles are continuation patterns that typically form when price consolidates within converging trendlines.
Other popular chart patterns include Double Tops and Bottoms, Flags, and Wedges. These patterns all indicate potential price movements and can be used by traders to enter trades at the optimal points.
Drawing stock charts manually is an essential skill for traders who want to understand the mechanics of price movement and identify key levels and patterns. By using tools like trendlines, support and resistance lines, and recognizing chart patterns, traders can gain deeper insights into market behavior and make better-informed decisions.
While charting manually takes practice and patience, it provides a level of detail and clarity that automated tools often miss. Through regular practice and the use of these essential drawing techniques, traders can build a more comprehensive and robust understanding of the markets, leading to greater confidence in their trading strategies.
A snapshot of the daily updates that help traders stay aligned with market direction.

Above The Green Line’s systematic approach has completely transformed my trading. I’ve gone from inconsistent results to reliable gains, even during market downturns.”
The systematic approach has been a game-changer for my portfolio. I no longer second-guess my trading decisions and have seen consistent returns even in volatile markets.”
Sarah K.
Michael R.
Engineer & Part-time Trader
The community aspect is invaluable. Being able to learn from experienced traders and discuss strategies in real-time has accelerated my trading knowledge tremendously.
David L.
Business Owner