
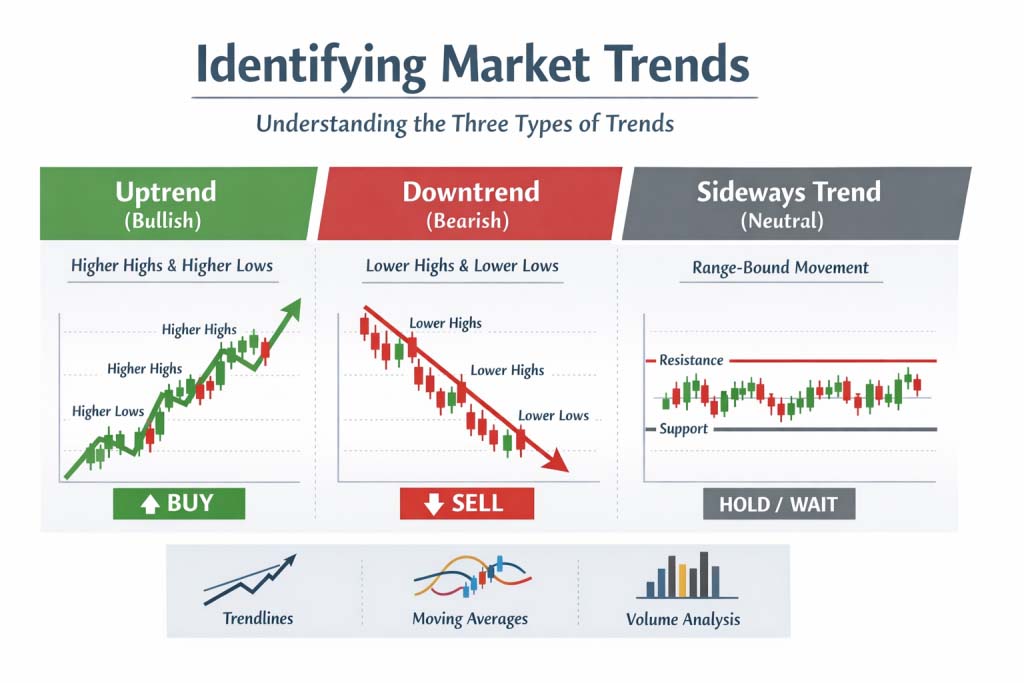
A trend in stock charts refers to the general direction in which the price of a security moves over a period of time. The trend is the backbone of technical analysis, and it forms the basis for making predictions about a stock’s future movement. Trends can be classified into three major categories:
Understanding these types of trends is crucial for recognizing the market’s direction and determining when to enter or exit trades.
The price axis, also known as the Y-axis, is the vertical line on a stock chart that represents the price levels of a stock. This axis shows the range of prices for the stock over the selected time period. The Y-axis helps you track how the stock price fluctuates during that time period, whether it’s rising, falling, or remaining stable.
An uptrend is characterized by a series of higher highs and higher lows. This indicates that buyers are in control of the market and the price is gradually moving upward. In an uptrend, each rally (or price rise) surpasses the previous high, and each pullback (or price dip) doesn’t fall below the previous low.
How to Identify an Uptrend:
Uptrends present potential buying opportunities, as the stock is showing consistent upward momentum.
A downtrend occurs when a stock is consistently making lower lows and lower highs. This indicates that sellers are in control and the price is moving downward over time. Each successive rally fails to reach the previous high, and each pullback is followed by a lower low.
How to Identify a Downtrend:
Downtrends present potential selling or shorting opportunities, as the stock is showing consistent bearish momentum.
A sideways trend, also known as a range-bound trend, occurs when a stock’s price moves within a defined range, without forming a clear upward or downward movement. In this scenario, the stock’s price fluctuates between a level of support (the lower price level) and a level of resistance (the upper price level).
How to Identify a Sideways Trend:
Sideways trends often lead to periods of market consolidation before the stock either breaks out of the range (creating a new trend) or reverses its direction. Traders typically use technical indicators and chart patterns to anticipate the breakout direction from a sideways trend.
Identifying a trend on a stock chart is just the beginning. To make informed decisions, you need to confirm the trend and understand its potential longevity. Below are some techniques and tools you can use to confirm trends and interpret them effectively.
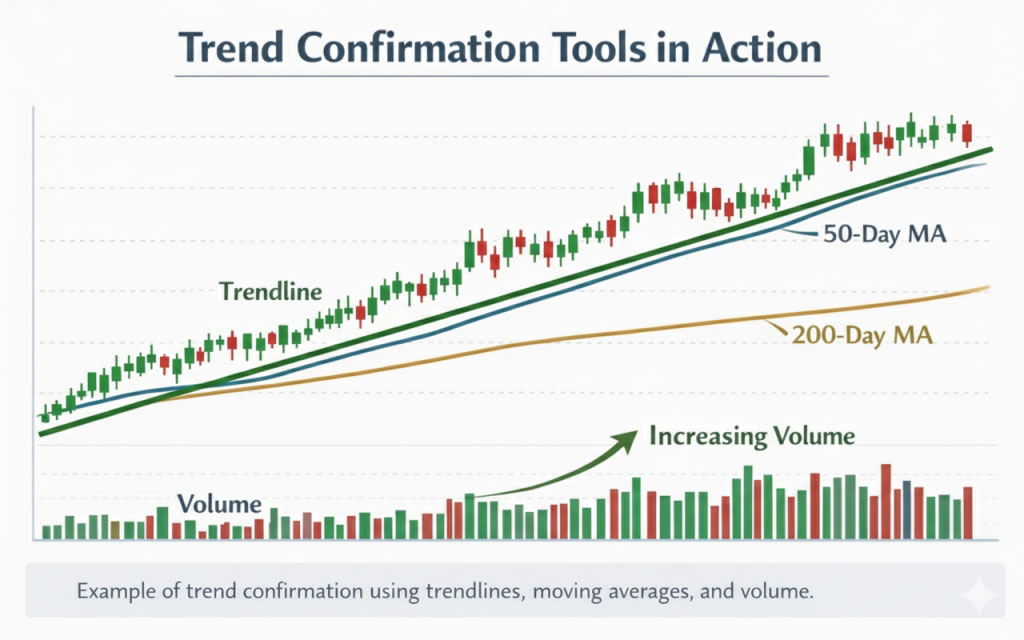
Trendlines are one of the simplest yet most powerful tools for identifying and confirming trends. A trendline is a straight line that connects two or more price points. In an uptrend, a trendline connects the lows, while in a downtrend, it connects the highs. By drawing trendlines, you can visually see the trend’s direction and strength.
Trendlines can also be used to create trend channels, where the price moves between an upper and lower trendline. The price tends to bounce between these two boundaries until a breakout occurs.
Moving averages are commonly used to smooth out price fluctuations and help identify the direction of a trend. The 50-day moving average (MA) and 200-day moving average (MA) are particularly useful for spotting long-term trends.
Price patterns like head and shoulders, triangles, and flags can provide additional confirmation of trend changes. These patterns can indicate a potential reversal or continuation of the current trend.
Volume is another essential tool in confirming trends. The importance of volume lies in the fact that it can provide insights into the strength of a trend. A trend with increasing volume suggests that the trend is likely to continue, while a trend with declining volume may indicate weakening momentum or a reversal.
Identifying trends is an essential skill for successful trading and investing. By recognizing and confirming uptrends, downtrends, and sideways trends, you can make more informed decisions about your entry and exit points in the market. Understanding the tools and techniques used to identify and confirm trends, such as trendlines, moving averages, price patterns, and volume analysis, will significantly improve your ability to interpret stock charts.
With practice, you’ll be able to spot trends more easily and make more confident decisions based on technical analysis. By incorporating trend identification into your trading strategy, you can align yourself with the broader market sentiment and capitalize on potential price movements.
For more detailed information on specific trend analysis techniques, visit our related pages on Price Trends and Trendlines and Volume and Price Action.
A snapshot of the daily updates that help traders stay aligned with market direction.

Above The Green Line’s systematic approach has completely transformed my trading. I’ve gone from inconsistent results to reliable gains, even during market downturns.”
The systematic approach has been a game-changer for my portfolio. I no longer second-guess my trading decisions and have seen consistent returns even in volatile markets.”
Sarah K.
Michael R.
Engineer & Part-time Trader
The community aspect is invaluable. Being able to learn from experienced traders and discuss strategies in real-time has accelerated my trading knowledge tremendously.
David L.
Business Owner