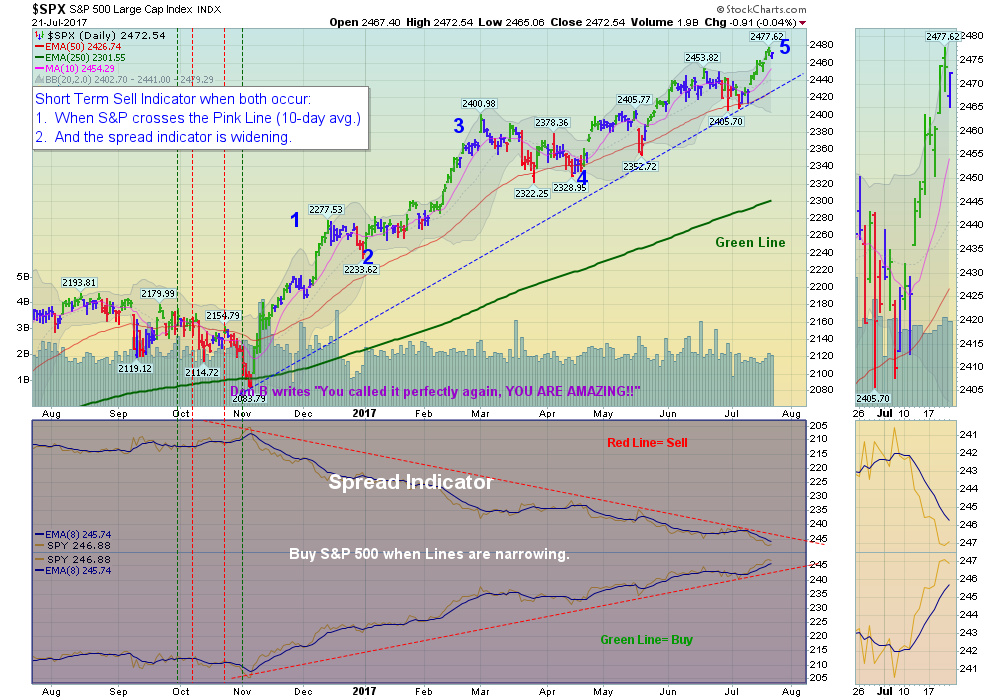
07/23/2017: Markets were able to make new Highs this week, after bouncing off the Red Lines (50-day avg.) in early July. Most Indices are making new Highs, but not many individual stocks are. Most Leaders are in the Red Zones, so Short Term Traders should be raising Cash.
The TECH Stocks were able to make New Highs without AAPL and GOOGL.
Long Term Interest Rates dropped down this week, and the US Dollar made New Lows.
MONEY WAVE BUYS SOON: We are currently in 1 logged Open Position, and there are 3 Investments are on the Short Term Watch List.
LONG TERM TRADES – The Funds below are currently out of favor, but historically could possibly Double or more from these lower levels. We are looking for a good Entry Point for these, but need the entire Economy to pick up speed:
DBC COMMODITY FUND Waiting for Break Out Above $16.08.
DDD 3D SYSTEMS CORP. Waiting for Green Zone Pull-back.
IPI INTREPID POTASH Waiting for Break Out Above $3.04.
JJC COPPER FUND Waiting for > 90 Relative Strength.
KOL COAL FUND Waiting for > 90 Relative Strength.
LL LUMBER LIQUIDATORS Buy Above $26.22 on Close.
MDR MCDERMOTT INT’L. Waiting for > 90 Relative Strength.
UGA US GASOLINE FUND Waiting on Break Out Above $32.03.
VALE VALE DE RIO Waiting for > 90 Relative Strength.
Click for Portfolio (Open Positions)
Click for Watch List
Click for Closed Positions
Alert! Market Risk is High (Red Zone). The probability of successful Short Term Trades is lower, when the S&P 500 is Way Above the Green Line. Even the Strongest Funds can get chopped up. Either take quick gains from Money Wave Pops, or STAY IN CASH & WAIT for a larger correction.
[s_static_display]
Tell your Friend about us, and HELP ANIMALS.
QUESTION: Walter writes “What is the Spread Indicator?”
ANSWER: Hi Walter, the Spread Indicator is just a visual, and is a Chart of –SPY on top of SPY.
As long as the Black Lines are narrowing, the Bull is well.
When the Black Lines widen outside the Blue Trend Lines, you should EXIT the S&P 500.


