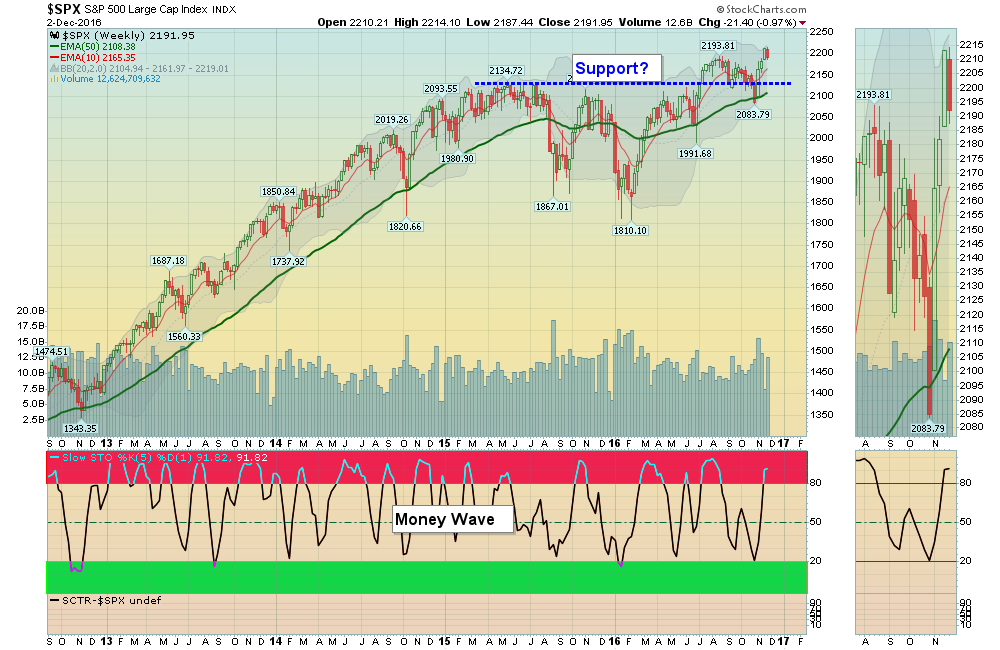
12/4/2016: Markets were down slightly for the week, after being extremely over-bought. The S&P 500 is back up in the Red Zone on the weekly Chart above, and is also at the Top Bollinger Band from the Trump rally. Normally a pull-back to the Red Line (50-day avg.) is needed soon to re-charge the rally. Many Leaders are quickly back down in the Daily Green Zones, so they should bounce up soon to re-test their recent highs.
The US Dollar is starting to correct, so the Gold Miners might start up soon. There is FEAR in the Miners, as they have been correcting down 36% from the August highs. That is a lot, but remember, GDXJ had a run from $17 to $52 this year (205%), so a normal Wave 2 Correction is 38%. If the Elliott Wave count is correct, and GDXJ is going down on Wave 2, Wave 3 UP could go up to $91 from this low! Wait for strength and Buy Signal.
Don’t forget that Interest Rates are up 85% since the Summer!
Please view the Leader List Charts for pending Money Wave Buys & Open Positions.
Money Wave Buys on Friday for FCX JWN & SGEN.
ON DECK: AMKR BBY GGB IWM MRVL MU NAVI SMH WEN
Be patient and wait for Money Waves Buys. We will email you when they are ready.
Click for Watch List
Click for Open Positions
Click for Closed Positions
Alert! Market Risk HIGH (Red Zone). The probability of successful Short Term Trades is lower, when the S&P 500 is Way Above the Green Line. Even the Strongest Funds can get chopped up. Either take quick gains from Money Wave Pops, or STAY IN CASH & WAIT for a larger correction.
Tell your Friend about us, and HELP ANIMALS.


