The Markets are down today, as the S&P 500 Failed to surpass the recent 2401 Highs, which caused selling. The Financials have really Dumped today, but many are now in the Green Zones to Buy soon.
The Leading Semiconductors and Techs made new Highs near the opening, but have pulled back.
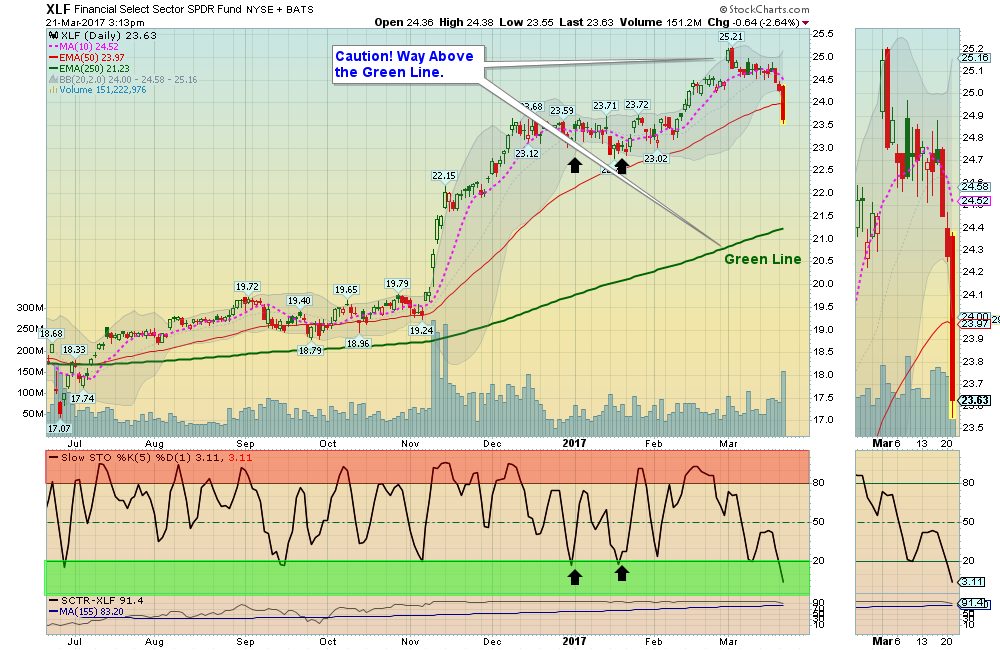
The Reward / Risk ratio of investing now is poor, so please do not Buy unless you are VERY NIMBLE, as the Leaders are still Way Above the Green Lines.
Many Money Wave Buys soon!
The Following Investments will probably have a Money Wave Buy Signal
(Slow Stochastic Closing > 20) on today’s Close.
BUYS: NONE TODAY
ON DECK to Buy soon: BAC BANK OF AMERICA, CSX CSX CORP, GS GOLDMAN SACHS, GV GOLDFIELD CORP, & XLF FINANCIAL FUND, We will email when it is ready.
SELLS
EXIT AKS AK STEEL if it is going to Close Below the Pink Line of $7.97. (Short Term Portfolio only).
We are Lowering the Sell Stop Loss on CFG CITIZENS FINANCIAL to Support at $33.67, and will hope to EXIT around $37 in a few days.
EXIT X US STEEL if it is going to Close Below the Pink Line of $36.15.
EXIT EXEL EXELIXIS INC. if it is going to Close Below your Buy Price, or $21.85.
EXIT FCAU FIAT CHRYSLER if it is going to Close Below the Pink Line of $11.14.
Click for WATCH LIST
Click for PORTFOLIO (Open Positions)
Click for CLOSED POSITIONS
Many like to Buy the day before, near the Close, if the Money Wave is going to create a Buy Signal (Closing > 20).
Don’t Buy if the Investment has already popped up too much. Money Wave Buys are usually good for a 3-6 % move in a few days.
About 1/3 of the time, the Money Wave Buys will result small losses, so please use a Sell Stop Loss after all Buy orders.


