XLK Chart
The Tech Fund Bounced off the Red Line.


Markets “Gapped Up” today, as the Leading DOW Index, and the Tech Fund bounced up off their Red Lines (50-day avgs.)

The weaker Investments that fell below their Red Lines are not doing as well. The S&P 500 is trying to Close above its Red Line of 2446.

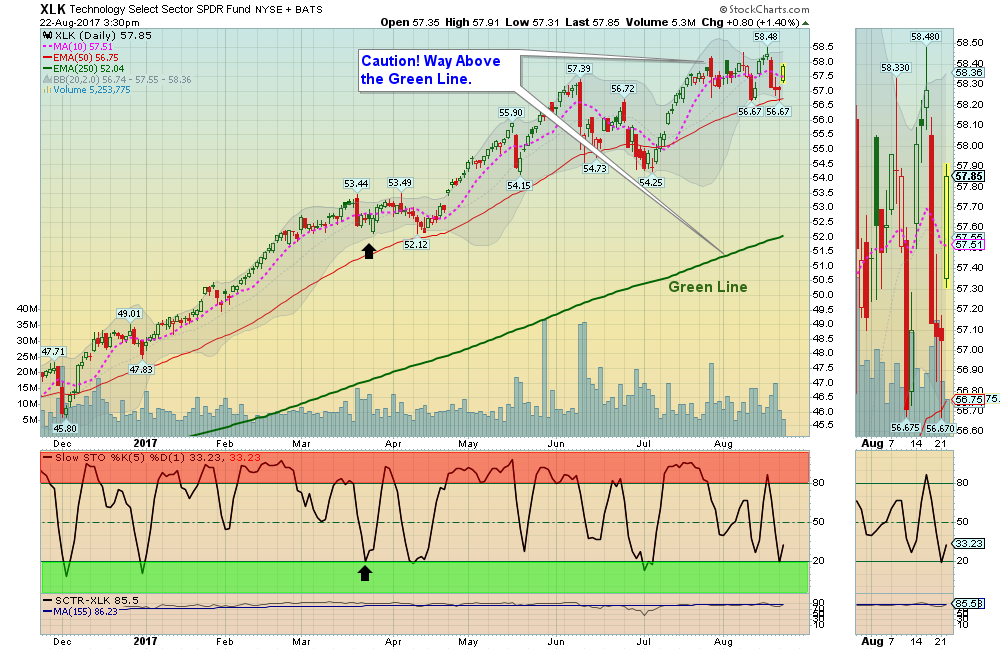
Try to Buy Investments that can Hold above their Red Lines. 

Crude Oil  is up today at $47.80 / barrel.


Money Wave Buys soon!  
The Following Investments will probably have a Money Wave Buy Signal 
(Slow Stochastic Closing > 20) on today’s Close.

BUYS TODAY:   

FB   FACEBOOK INC  Money Wave Buy today. Place Sell Stop Loses below $165.82 on the Close.

IPI   INTREPID POTASH   Money Wave Buy today for the Long Term Portfolio. Place Sell Stop below the Green Line of $2.40 on weekly Close.

FGEN   FIBROGEN INC   Money Wave Buy today. We will not log FGEN, as the Volume is low.

EWP   SPAIN FUND   Money Wave Buy today. We will not log EWP, as the Volume is very low.

JD   JD.COM   Money Wave Buy today. We will not log JD, as it is still below the Red Line.

VRTX   VERTEX PHARM   Money Wave Buy today. We will not log VRTX, as it is already up 4% today.

We will “Not Log” trades if the Reward/Risk is not at least 2:1.


Money Wave Buys soon for:   HRB   H&R BLOCK,    RH   RESTORATION HARDWARE,   &  SQ   SQUARE INC.  We will email you when they are ready. Click on WatchList

Emotions are very high now, so please do not Buy unless you are VERY NIMBLE. The Leaders are still Way Above the Green Lines (all Investments eventually return to their Green Lines).


SELLS TODAY:  NONE TODAY


PORTFOLIO  (Open Positions)

Click for  CLOSED POSITIONS

Many like to Buy the day before, near the Close, if the Money Wave is going to create a Buy Signal (Closing > 20).

Don’t Buy if the Investment has already popped up too much. Money Wave Buys are usually good for a 3-6 %  move in a few days. We will “Not Log” trades if the Reward/Risk is not at least 2:1.

Related Post

WatchList

5 Responses

  1. Hi, I have some problem in defining the positon for a trade like IPI.

    Suppose I have 50K and as you suggest I split in five positions. That means I have 10K to invest in IPI and I should buy 10.000 / 3,32 = 3.012 shares.

    Suppose that the trade go wrong and I take the full loss at the stop. That means that I will have a loss of (2,41-3,32) x 3.012 = – 2.770 or 6% of the initial portfolio.

    Does it make sense?

    Thanks

    1. That is a great question Gian. Yes a Long Term Investment needs plenty of slack to fluctuate when coming off the bottom…

      If IPI does not go broke, it could possibly return to 50 or 100 % of the previous High of $40.22… That means somebody paid $121,143 for the 3012 shares that you are considering buying for $10,000.

      You might not want to risk a 28% loss to the Green Line on $10,000. Another way to look at it is Reward / Risk. It is possible that IPI could return to $20 or higher over several years (or $16.68 gain).

      It could also go down and you could lose $0.92 if it Closed below the Green Line. So your possible Reward / Risk could be $16.68 / $0.92 or 18 : 1 !!! Not many Investments offer that potential, ever…

      You might want to Buy less than $10,000 IPI, if you don’t want the downside potential, but then you could miss a HOMERUN.

      IPI Chart

      1. Thanks for the replay.

        Anyway why don’t you use the approach where for every position you risk only 1% of the porfolio?

        I mean instead of putting at risk 6% of the potfolio you could put at risk only 1% and take advantage of the 18:1 potential.

        I am sking you to understand if you have verifiec that with your method is better to use the same amount of money for each investment instead of the same amout of risk (1% of the capital)

        Thanks,

Leave a Reply