• Market Insights
        • Commentary
          • Daily
          • Weekly
        • BUY / SELL SIGNALS
          • Trade Posts
          • Recent Trade Alerts
          • Recent Day Trades
        • BLOGROLL
          • Dividend Growth Blog
          • ETF Sector Blog
          • Dow Dogs
          • TPOW Blog
  • Strategies
        • SWING TRADING
          • Current Positions
          • Watchlists
          • Closed Positions
          • Candidates - TOP 100
          • Specialty Stocks
        • WEEKLY STOCK PICK
          • TPOW Charts
          • TPOW Performance
          • TPOW Strategy Guide
          • TPOW Performance Dashboard
        • DAY TRADING
          • Watch List
        • ATGL DASHBOARD
        • ETF STRATEGIES
          • ETF Sector Rotation
          • ETF Sector Portfolio
        • DIVIDEND GROWTH
          • Dividend Growth Portfolio
          • Dividend Calendar
        • DOGS OF THE DOW
          • Dogs of the Dow Portfolio
          • DOW 5 Portfolio
  • Markets
        • US MARKET
          • Commodities
          • Energy
          • Precious Metals
          • Volatility
        • GLOBAL MARKETS
          • Market Indices
          • Economic Calendar
          • FOREX Heat Map
          • FOREX Cross Rates
          • Crypto Currency Market
  • Investing
    • Discord Community
    • Dashboard
  • Resources
        • ARTICLES
          • Dividend Growth Model Articles
          • ETF Articles
          • Investment Strategies Articles
          • Market and Economic Insights
          • Stock Trade Articles
          • Stock Reviews
        • TOOLS
          • Stock Scanners
          • Charting Software
          • Brokerage Firms
        • STOCK CHARTS
          • Key Components
          • Reading Charts
          • Drawing Stock Charts
          • Identifying Trends
        • RETIREMENT PLANNING
  • About
    • Contact Us
    • How to Win
    • #1 At Stockcharts
    • Disclaimer
    • FAQ
  • Log In
  • Subscribe
Menu
  • Market Insights
    • Commentary
      • Daily
      • Weekly
    • BUY / SELL SIGNALS
      • Trade Posts
      • Recent Trade Alerts
      • Recent Day Trades
    • BLOGROLL
      • Dividend Growth Blog
      • ETF Sector Blog
      • Dow Dogs
      • TPOW Blog
  • Strategies
    • SWING TRADING
      • Current Positions
      • Watchlists
      • Closed Positions
      • Candidates – TOP 100
      • Specialty Stocks
    • DAY TRADING
      • Watch List
    • WEEKLY STOCK PICK
      • TPOW Charts
      • TPOW Performance
      • TPOW Strategy Guide
      • TPOW Performance Dashboard
    • DIVIDEND GROWTH
      • Dividend Growth Portfolio
      • Dividend Calendar
    • DOGS OF THE DOW
      • Dogs of the Dow Portfolio
      • DOW 5 Portfolio
    • ETF STRATEGIES
      • ETF Sector Rotation
      • ETF Sector Portfolio
    • ATGL DASHBOARD
  • Markets
    • US MARKET
      • Commodities
      • Energy
      • Precious Metals
      • Volatility
    • GLOBAL MARKETS
      • Market Indices
      • Economic Calendar
      • FOREX Heat Map
      • FOREX Cross Rates
      • Crypto Currency Market
  • Investing
    • Discord Community
    • Dashboard
  • Resources
    • ARTICLES
      • Dividend Growth Model Articles
      • ETF Articles
      • Investment Strategies Articles
      • Market and Economic Insights
      • Stock Trade Articles
      • Stock Reviews
    • TOOLS
      • Stock Scanners
      • Charting Software
      • Brokerage Firms
    • STOCK CHARTS
      • Key Components
      • Reading Charts
      • Drawing Stock Charts
      • Identifying Trends
    • RETIREMENT PLANNING
  • About
    • Contact Us
    • How to Win
    • #1 At Stockcharts
    • Disclaimer
    • FAQ
  • Log Out
    • Members-Page
    • Referral
  • Log In
  • Subscribe
Log In
Log Out
Subscribe

Hang Seng China H-Financials Index

Hang Seng China H-Financials Index

The Hang Seng China H-Financials Index is a stock market index that tracks the performance of major Chinese financial companies listed on the Hong Kong Stock Exchange (HKEX). Launched in 2010, this index includes a range of firms, such as banks, insurance companies, and securities firms, providing a comprehensive view of the financial sector in China. The index is designed to reflect the overall performance and health of these companies, which play a critical role in the Chinese economy.

Why is the Hang Seng China H-Financials Index Important?

  1. Economic Indicator: The index serves as a barometer for the Chinese financial sector, which is a key driver of the country’s economic growth. Movements in the index can provide insights into broader economic conditions, including consumer confidence and investment trends.
  2. Investment Benchmark: The Hang Seng China H-Financials Index is widely used by investors and fund managers as a benchmark for the performance of financial stocks in China. Many financial sector-focused funds and ETFs track this index, making it a critical reference for assessing investment performance.
  3. Access to China’s Financial Sector: As one of the world’s largest and fastest-growing economies, China’s financial sector offers significant investment opportunities. The index provides a way for investors to gain exposure to this dynamic market.

Why Should You Use the Hang Seng China H-Financials Index?

  1. Sector Focus: For investors interested in the financial sector, the index offers targeted exposure to key players in China’s banking, insurance, and securities industries, which can be essential for sector-specific investment strategies.
  2. Diverse Portfolio: Investing in the Hang Seng China H-Financials Index can enhance portfolio diversification. It includes a range of companies with varying market capitalizations and business models, reducing the risk associated with individual stock investments.
  3. Insights into Market Trends: Monitoring the index allows investors to stay informed about the performance of Chinese financial stocks and emerging trends in the sector. This can be valuable for making informed investment decisions.

Should You Invest in the Hang Seng China H-Financials Index?

Investing in the Hang Seng China H-Financials Index can offer several benefits, but potential investors should be aware of the associated risks:

  1. Growth Potential: China’s financial sector has significant growth potential, driven by urbanization, rising incomes, and increased demand for financial services. This makes the index an attractive option for investors seeking exposure to high-growth industries.
  2. Regulatory Environment: The Chinese financial sector is subject to regulatory changes, which can impact company performance and stock prices. Investors should stay informed about regulatory developments and their potential effects.
  3. Market Volatility: While the financial sector can offer growth, it is also subject to market fluctuations and economic cycles. Investors should be prepared for potential volatility in the index.
  4. Investment Vehicles: There are various exchange-traded funds (ETFs) and mutual funds that track the Hang Seng China H-Financials Index, making it easier for investors to gain exposure to this sector without needing to pick individual stocks.

In conclusion, the Hang Seng China H-Financials Index is an essential tool for understanding and investing in China’s financial sector. It offers insights into market trends and opportunities for growth, making it appealing for investors. However, thorough research and consideration of market dynamics are crucial before making investment decisions in this sector.


Related Articles

MACD Indicator

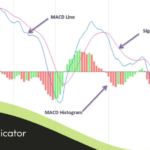
MACD Indicator: How To Use Moving Average Convergence Divergence in Trading

The Moving Average Convergence Divergence (MACD) indicator is one of the most widely used technical analysis tools available to traders ...
Read More
Fibonacci Retracement

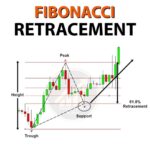
Fibonacci Retracement: How To Use It for Support, Resistance, and Trade Entries

Knowing how to identify key price levels is critical in any successful trading methodology. Among the most relied-upon tools for ...
Read More
Bollinger Bands

Bollinger Bands: How to Trade Volatility and Spot Breakout Opportunities

Bollinger Bands represent one of the most versatile tools in technical analysis, providing traders with important information about price volatility ...
Read More
Rounding Bottom Pattern

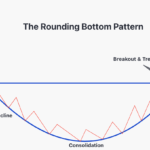
Rounding Bottom Pattern: How to Trade This Gradual Bullish Reversal

In trading, the rounding bottom pattern represents a significant bullish reversal formation that develops gradually over extended periods. This pattern ...
Read More
Rectangle Pattern in Trading

Rectangle Pattern in Trading: How To Identify and Profit from Price Consolidation

In technical analysis, price action often moves in identifiable patterns. Among the most common and reliable is the rectangle pattern ...
Read More
  • 1
  • 2
  • 3
  • …
  • 15
  • Next
Loading...

Investing with Rules.

On ATGL

  • DashBoard
  • Weekly Commentary
  • Daily Buy / Sell Signals
  • Day Trade Setup
  • Trading Rooms

Strategies

  • Swing Trading
  • ATGL Pick of the Week
  • Dividend Growth
  • ETF Sector Rotation
  • Dogs of the Dow

Help

  • ATGL Trading Rules
  • FAQ
  • Account Maintenance
  • Contact US
  • Join

Stay Updated

No credit card required. Unsubscribe anytime

Check your inbox or spam folder to confirm your subscription.

© 2024 Above The Green Line. All rights reserved.

  • Twitter
  • LinkedIn
  • YouTube