12/4/2022 Markets were slightly higher for the week as most of the major Indices returned back up the Green Lines (like they always do). Now the Markets need the FED to stop tightening (raising short term Interest Rates) after their Dec 14th meeting. for stocks to go much higher.
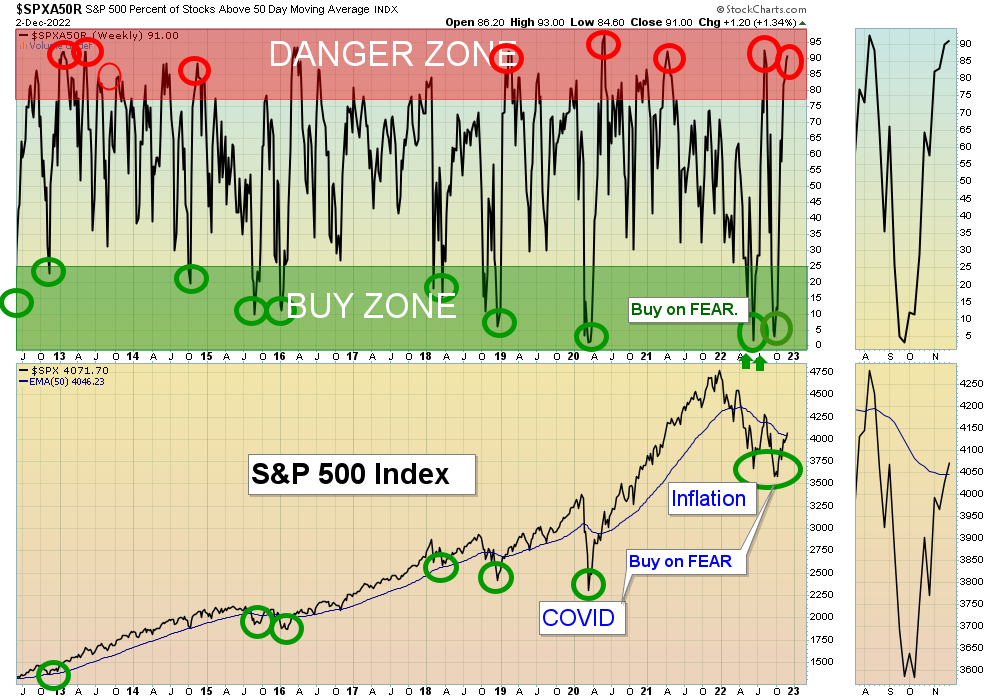
This week the FED started walking back their “hawkish” tightening talk after Inflation numbers are slowing. This is what the Markets have been waiting for. The FEAR level have dropped very low now and the Greed Level (put/call ratio) is high. We like to Buy on FEAR, when stocks are on Sale.
The US Dollar and long term Interest Rates have come down, as the Economy has weakened from FED Tightening. But the Dollar and long term Interest Rates should have enough upward momentum to go back up and re-test the recent highs again (UUP & TBT Buys soon). Don’t be surprised if the Media creates another FEAR cycle, causing Stocks to pull back and the Leaders will return back down into the Green Zones for Money Wave Buys again.
If you continue to Follow the Green Line System, your Money should flow into the Strongest areas and your account value should be able to grow in both Bull and Bear Markets.
________________________________________________________________________________________________________________________________________________
For the week the Dow was up 0.36%, the S&P 500 was up 1.14% and the NASDAQ 100 was up 1.96%. Most of the major Indices do not have Relative Strength above 80, so you should currently own the stronger Securities here.
The Inflation Index (CRB) was down 0.07% for the week and is Above the Green Line, indicating Economic Expansion.
Bonds were up 4.32 % for the week, and are Below the Green Line, indicating Economic Expansion.
The US DOLLAR was down 1.34% for the week and is down near the Green Line.
Crude Oil was up 4.85% for the week at $79.98 and GOLD was up 3.17% at $1709.60.
Completed trades this week: ABBV Abbvie Inc. hit Target for 13.6 $ Gain. (Long Term Portfolio).
HLIT Harmonic Inc. hit Target for 13.7 % Gain.
More action this week on the Day Trading Scrolling Charts.
DAY TRADING CHARTS FOR INDICES & LARGE CAPS.
We have not had many intra-day Trade Alert signals lately as the Volume has been too Low with the Buy Signals. These low Volume Buy Signals tend to pop up and quickly fade back down. We like to see High Volume on rallies.
_____________________________________________________________________________________________
MONEY WAVE BUYS SOON:
We are in now in 5 logged Current Positions for the Short & Medium Term. There are 4 investments on the Short Term Watch List.
Be patient and WAIT for Green Zone Buy Signals!
LONG TERM INVESTMENTS: (Hard to find many Long Term now because most normal Investments no longer have 80 Relative Strength required.)
Long Term Scrolling Charts (Real Time)
BLU BELLUS HEALTH Moved above $9.84 this week with a 12% pop. Trade was not logged.
CROX CROX INC. Wait for the next Daily Money Wave Buy Signal.
PBR PETROBAS ENERGY Weekly Money Wave Buy Signal was good for an 11 % pop.
PDD PINDUODUO INC. Closed above $73.02 for a 31 % Break Out this week.
TBF INVERSE T-BOND FUND Wait for the next Weekly Money Wave Buy Signal.
UUP US DOLLAR FUND Wait for the next Weekly Money Wave Buy Signal.
VIPS VIPSHOP HOLDINGS Buy if it Closes above $13.32 with High Volume. (now in Stage 1 Base).
______________________________________________________________________________________________________
My Trading Dashboard
Swing Trading Scrolling Charts
Day Trading Scrolling Charts
Click for Watch Lists
Click for Current Positions
Click for Closed Positions
Updated Top 100 List Dec 1, 2022
Dividend Growth Portfolio
Updated ETF Sector Rotation System
Dogs of the DOW System
Long Term Strategy for IRAs & 401k Plans
CNN Fear & Greed Index
Scrolling Stage Chart Investing Charts
Alert! Market Risk is High (RED). The probability of successful Short Term Trades is better, when the % of stocks above the 50-day avg. is below 20.
Tell your Friends about the Green Line, and Help Animals.
________________________________________________________________________________
4 Ways to Get your Daily Money Wave Email Alert:
-
- Emailed to your box between 3:45 – 3:50 pm EST.
- Website menu Commentary/Buy/Sell Signals
- Twitter mobile notifications are the fastest @AboveGreenLine
- Text messages: Email us your Cell number & phone carrier.
Thank you,
ATGL
Related Post
– BLU